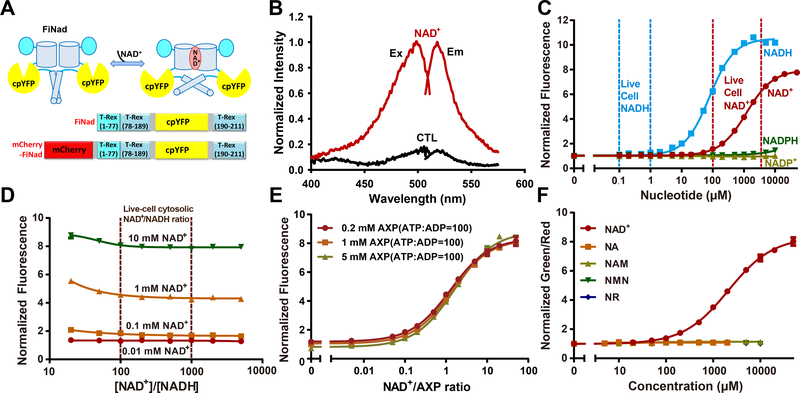
Figure 1. A highly responsive genetically encoded NAD+/AXP ratio sensor.
(A) Schematic representation of the NAD+ sensor FiNad. Fluorescent protein cpYFP was inserted into a monomer of NAD+(NADH)-binding bacterial protein T-Rex. Binding of NAD+ induces changes in protein conformation and fluorescence. (B) Fluorescence spectra of purified FiNad in the control condition (black), and saturated NAD+ (dark red). The excitation spectrum recorded at an emission wavelength of 535 nm has a maximum at 500 nm; the emission spectrum recorded at an excitation wavelength of 490 nm has a maximum at 518 nm. (C) Fluorescence responses of FiNad with excitation at 485 nm in the presence of different concentrations of NAD+ and its analogs (n=3). Data are normalized to the initial value. (D) FiNad sensor responds to the indicated [NAD+], but not to the NAD+/NADH ratio (n=3). Data are normalized to the fluorescence in the absence of NAD+. (E) FiNad fluorescence plotted against NAD+/AXP ratio at the indicated total adenine nucleotide concentration (n=3). Data are normalized to the initial value (1mM AXP). (F) The green/red ratio of mCherry-FiNad towards NAD+ or its precursors (n=3). Data are normalized to the initial value. For C, D and F, the total adenine nucleotide concentration was 1 mM. Data are the mean ± s.d. See also Figure S1, Table S1 and Table S2.

