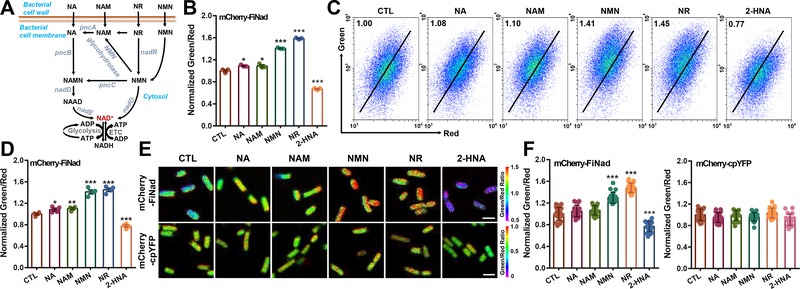
Figure 2. Imaging NAD+ metabolism in living bacteria.
(A) NAD+ biosynthesis from different precursors in bacteria. (B and C) Microplate assay (B, n=3) and flow cytometric analyses (C) of mCherry-FiNad fluorescence in E. coli BL21 (DE3) cells treated with NAD+ precursors or the pncB inhibitor 2-HNA. (D) Quantification of mCherry-FiNad fluorescence in panel C (n=4). (E and F) Fluorescence images (E) and quantification (F, n=20) of mCherry-FiNad or mCherry-cpYFP in E. coli BL21 (DE3) cells with NAD+ precursors or 2-HNA, scale bar, 2 μm. Data are the mean ± s.e.m (B, D) or mean ± s.d (F), normalized to the control condition (B, D, F). *P < 0.05, **P < 0.01, ***P < 0.001. See also Figure S2 and Table S3.

