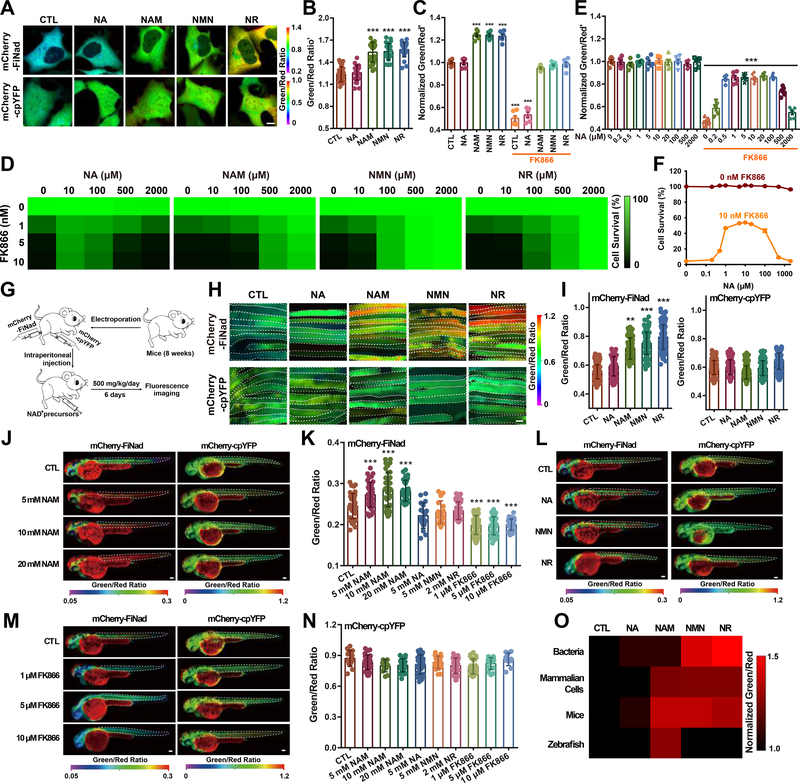
Figure 4. Mapping the different roles of NAD+ precursors in boosting NAD+ levels in various organisms.
(A) Fluorescence images of mCherry-FiNad or mCherry-cpYFP in HEK293 cells treated with NAD+ precursors, scale bar, 10 μm. (B) Quantification of mCherry-FiNad fluorescence corrected by mCherry-cpYFP in panel A (n=25). (C) Effect of different NAD+ precursors (2 mM) on cytosolic NAD+ levels in the absence or presence of FK866 (n=6). (D) Effect of different NAD+ precursors on FK866-triggered cell death shown as a heatmap, with data from Figure S4E. (E and F) Effect of different concentrations of NA on cytosolic NAD+ levels (E) and cell viability (F) in the absence or presence of FK866 (n=6). (G) General overview of the procedure for NAD+ imaging in muscle tissues of mice. (H and I) Fluorescence images (H) and quantification (I, left: n=171, 83, 70, 155, 154; right: n=173, 130, 148, 115, 129) of mCherry-FiNad or mCherry-cpYFP in muscle tissues of mice in response to different NAD+ precursors indicating regions of interest (white dashed line). Images are pseudocolored by R488/561. Scale bar, 100 μm. (J-N) In vivo fluorescence imaging (J, L, M) and quantification (K, n=39, 36, 42, 28, 19, 16, 37, 42, 33, 24; N, n=15, 30, 12, 24, 28, 24, 34, 27, 15, 12) of zebrafish larvae expressing mCherry-FiNad or mCherry-cpYFP in response to different concentrations of NAM (J), NAD+ precursors (L), or FK866 (M) indicating regions of interest. (O) A head-to-head comparison study of four common NAD+ precursors in enhancing NAD+ levels in different species shown as a heatmap, with data from Table S3. Data are the mean ± s.e.m (C, E, F) or mean ± s.d. (B, I, K, N). **P < 0.01, ***P < 0.001. See also Figure S4 and Table S3.

