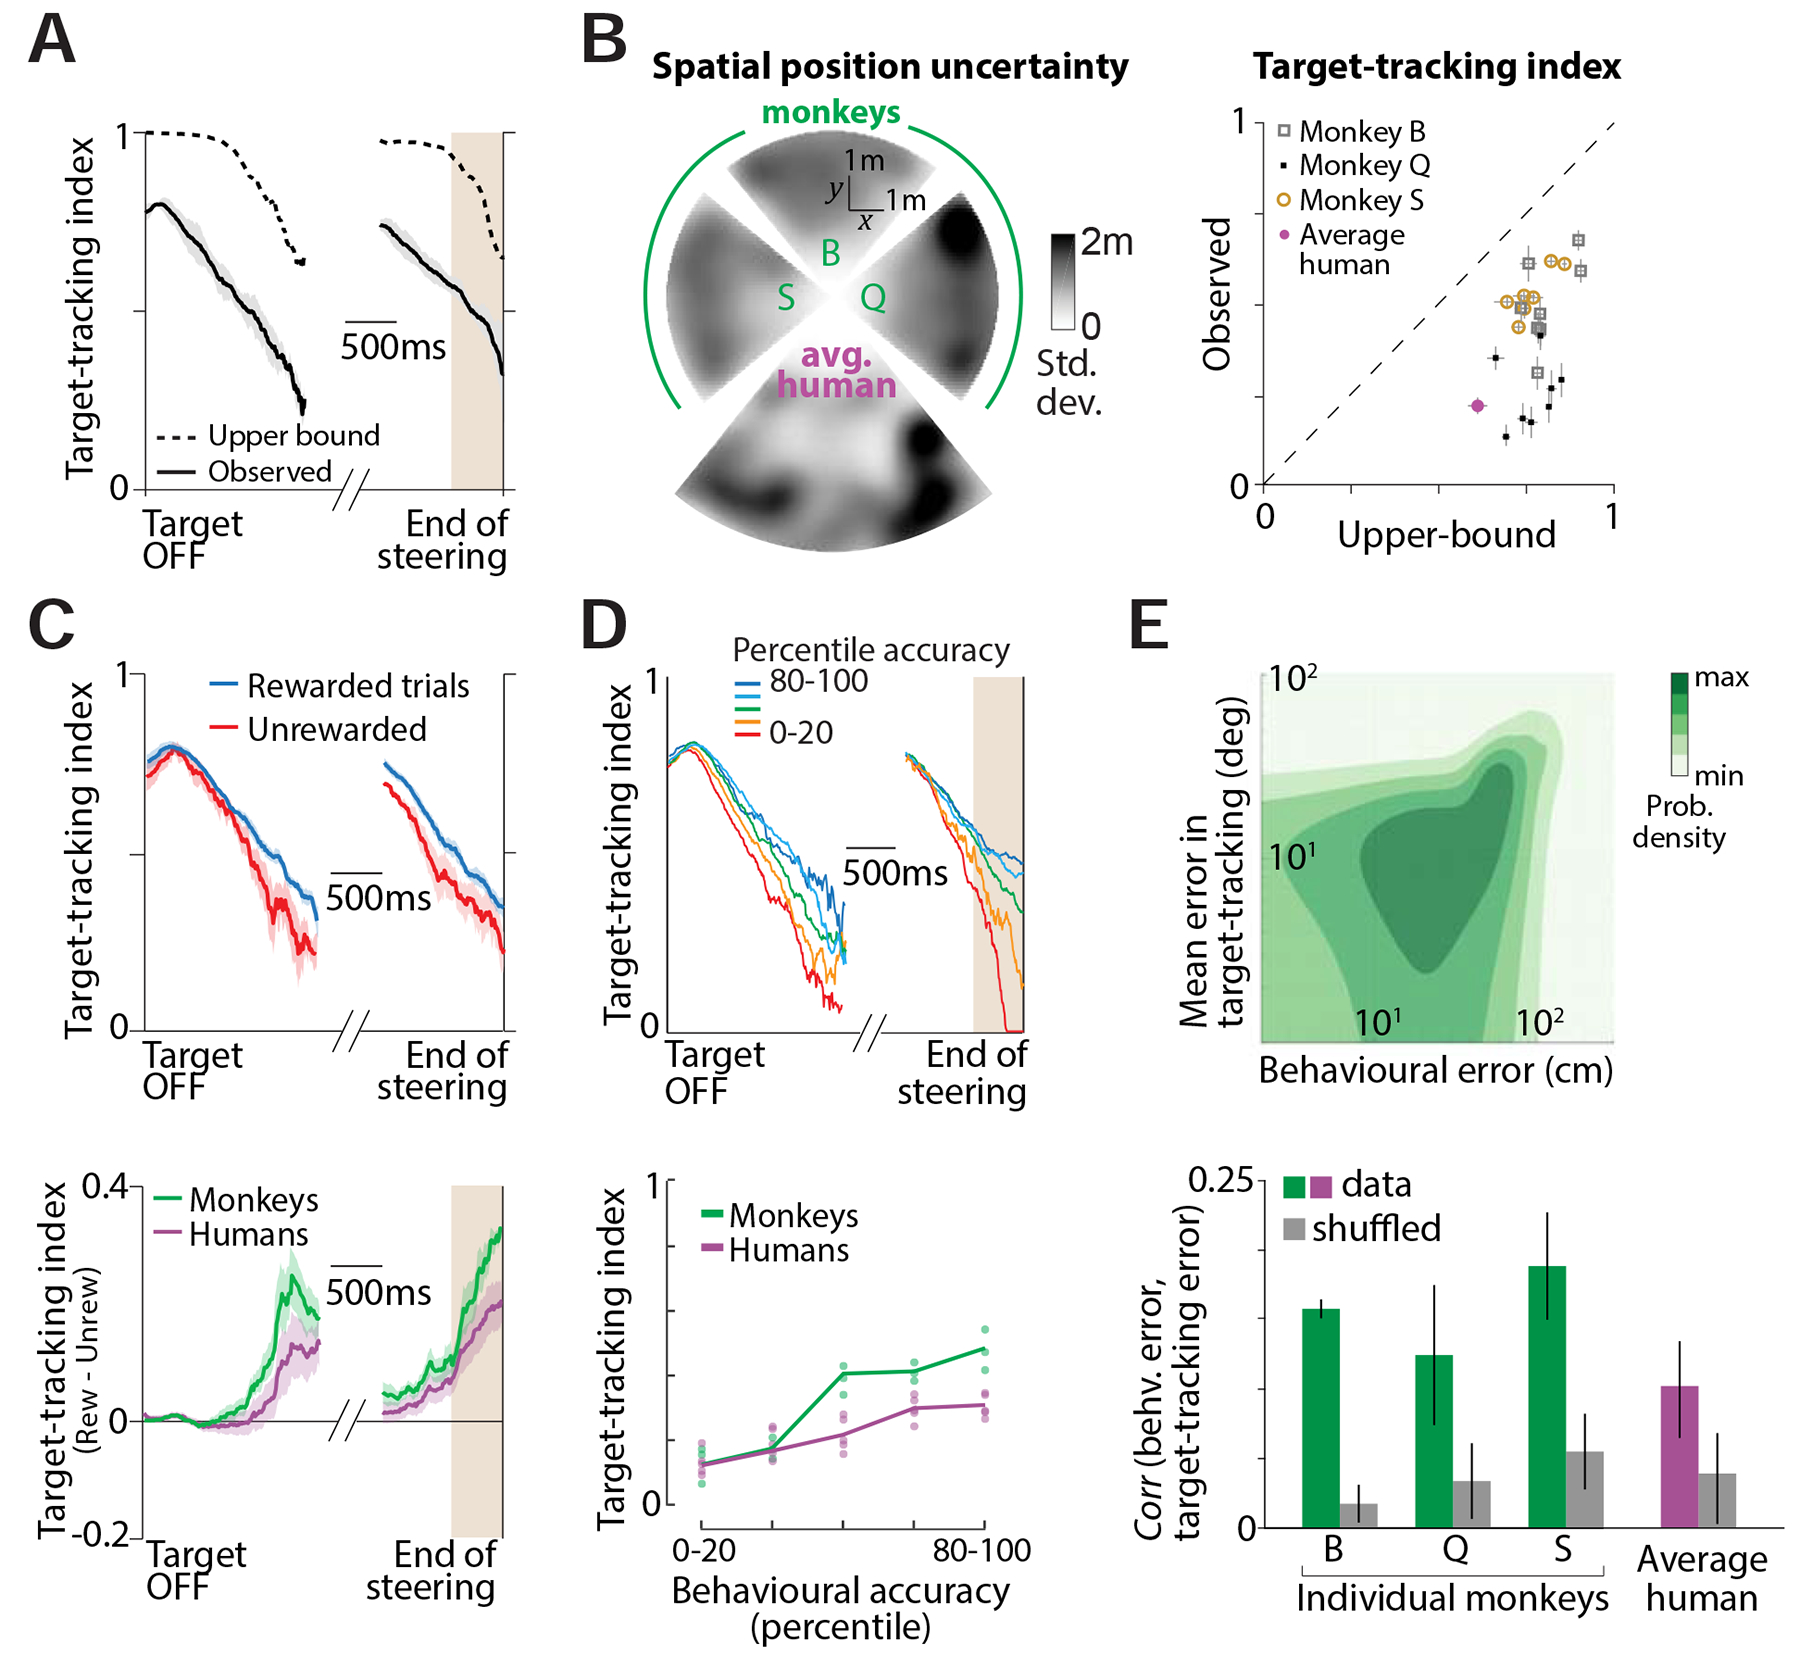
Figure 4. Accurate target-tracking is associated with increased task performance.

A. Time-course of the target-tracking index for one session computed using a monkey’s actual eye movements (black solid) and its theoretical upper-bound (black dashed) determined using variability in stopping positions (Methods, equations 3–4). B. Left. Overhead view of the spatial maps showing the standard deviation of stopping positions as a function of target location for individual monkeys and the average human subject. Each wedge corresponds to the map of one subject, calculated by binning target locations (see Fig. 1D) and smoothed using a Gaussian filter. The maps of monkey S & Q, and of the humans, have been rotated for compactness. Right: Comparison of the observed target-tracking index against the theoretical upper bound (averaged over the last 500ms of the trials) across all individual datasets. Dashed line has unity slope and error bars denote ±1 SEM obtained by bootstrapping. C. Top: Time-course of the target-tracking index for one example monkey shown separately for trials in which he stopped within the reward zone (blue), or stopped outside it (red). Shaded regions denote ± 1 standard error estimated by bootstrapping. Bottom: The difference between tracking coefficients the two sets of trials for all subjects. For human subjects, trials in which the subject’s final position was within 0.6m of the center of the target were considered ‘rewarded’. D. Top: We divided trials into five groups based on the magnitude of behavioural error. Time-courses of the target-tracking index for the five trial groups from one monkey (dark blue: most accurate; dark red: least accurate). Bottom: Average value of the target-tracking index just before the end of steering (brown region in the top panel) as a function of percentile accuracy for individual subjects. Solid lines show average across subjects. Across subjects (humans and monkeys), there was a significant correlation between accuracy and tracking coefficient (Pearson’s r = 0.68, p = 3.1 × 10⁻⁵). E. Top: Joint distribution of the behavioural error and the target-tracking error across trials of one session from one monkey. Bottom: The mean correlation between behavioural and target-tracking errors of individual subjects. Error bar denotes ±1 SEM obtained by bootstrapping. See also Figure S4D–E.
