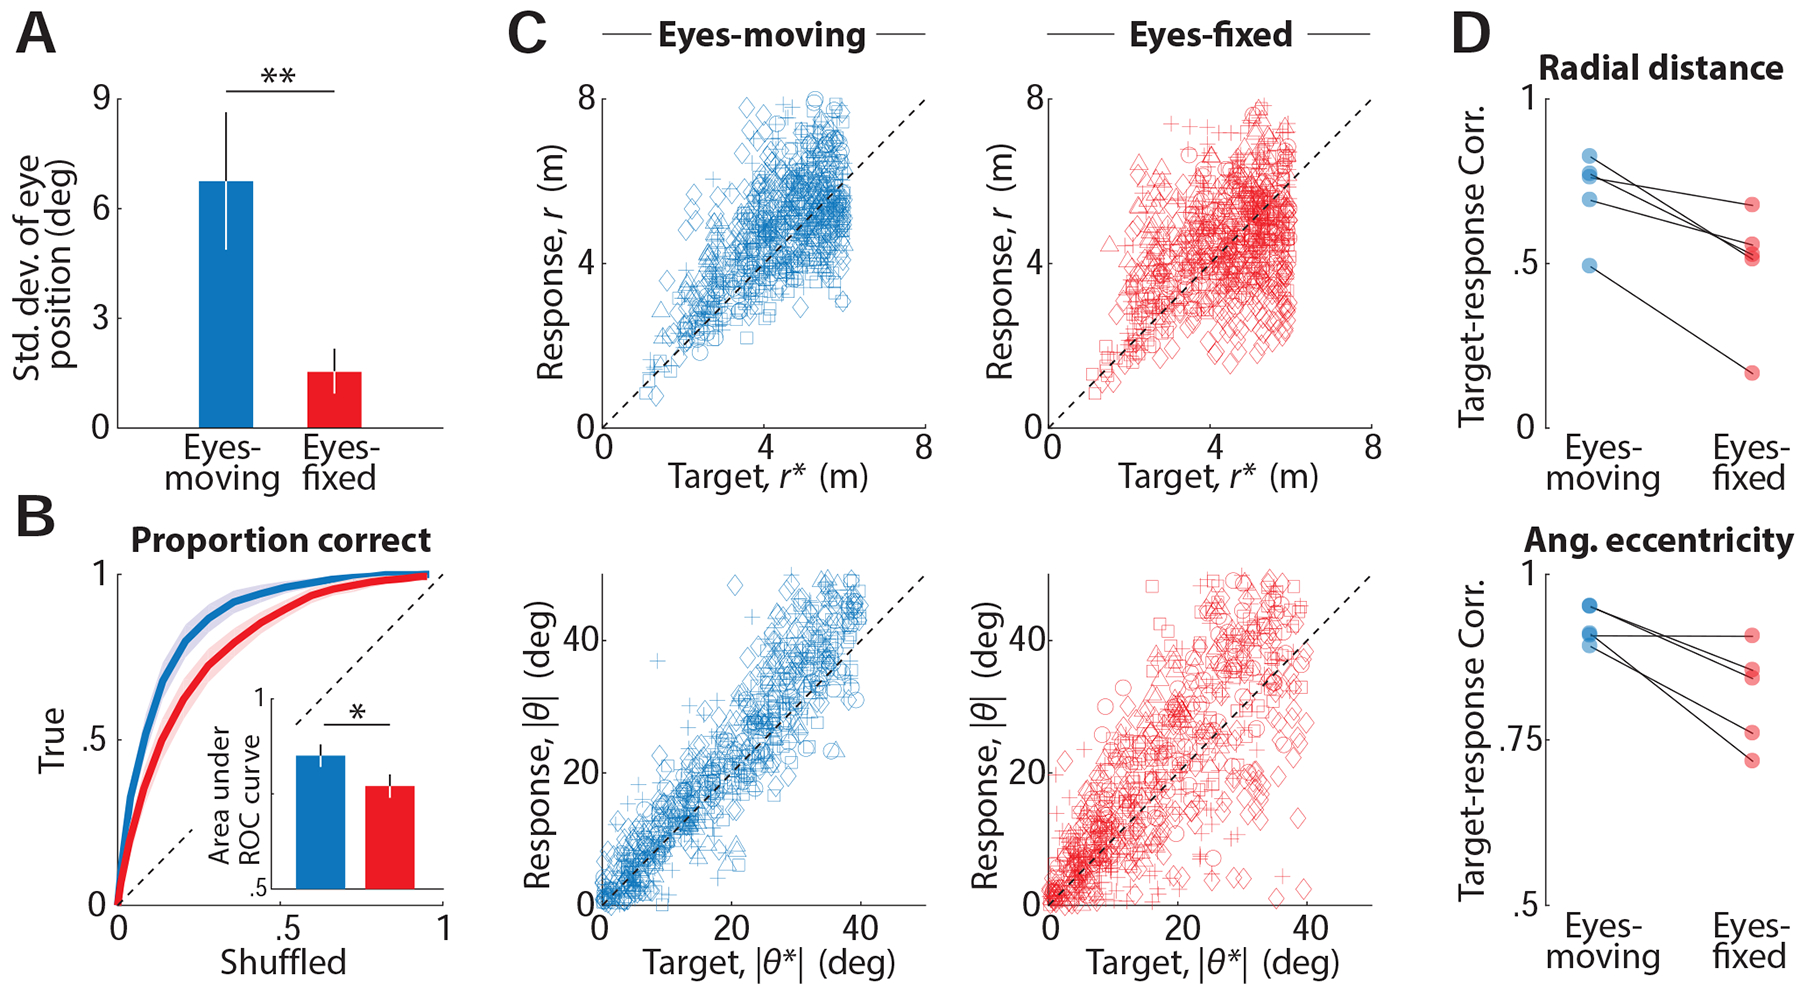
Figure 6. Fixation affects task performance.

A. Trial- averaged temporal variability of subjects’ eye position, quantified by standard deviation (see Methods) during ‘Eyes-moving’ (blue) and ‘Eyes-fixed’ (red) trials. Error bars denote standard deviation across subjects (** p = 1.2 × 10⁻³, paired t-test). B. ROC curves averaged across subjects, for trials in the ‘Eyes-moving’ (blue) and the ‘Eyes-fixed’ condition (red). Inset shows the area under the two curves. Error bars denote standard deviation across subjects (* p = 2.5 × 10⁻³, paired t-test). C. Top: Comparison of the radial distances of the response and the target on trials under the two conditions. Different symbols denote different human subjects. Bottom: Comparison of the (absolute) angular eccentricity of the response and target. D. Top: Pearson’s correlation coefficient between the radial distance of subjects’ response and the target for all individual subjects. Bottom: Similar comparison for the absolute angular eccentricity of target and response under the two conditions. See also Figure S6.
