. 2020 May 8;43(2):e20190328. doi: 10.1590/1678-4685-GMB-2019-0328

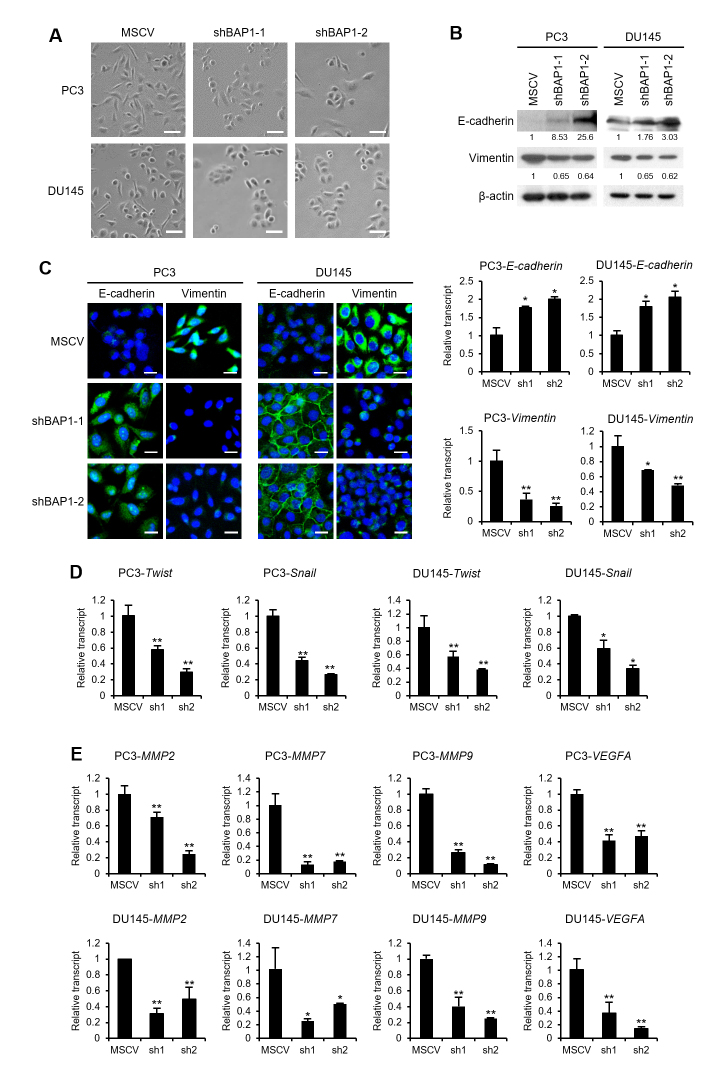
Figure 2. BAP1-knockdown induces MET in prostate cancer cells. (A) Images of PC3 or DU145 cells with BAP1-knockdown (100 magnification). Scale bar represents 100 μm. (B) Immunoblotting and real-time RT-PCR for E-cadherin and vimentin in BAP1-knockdown cell lines. The band density was quantified by densitometry. (C) Immunofluorescence for E-cadherin or vimentin (green) in BAP1-knockdown cells. Nuclear DNA was stained with DAPI and the image was merged with that of E-cadherin or vimentin. Scar bar represents 20 μm. (D) Real-time quantitative RT-PCR for Twist and Snail mRNAs in BAP1-knockdown cells. Values are expressed as mean ± SD of three independent experiments. (E) Real-time quantitative RT-PCR for MMP2, MMP7, MMP9, and VEGFA mRNAs in BAP1-knockdown cells. Values are expressed as mean ± SD of three independent experiments. The p values were calculated using Student’s t-test. *p < 0.05, **p < 0.01.

Figure 2