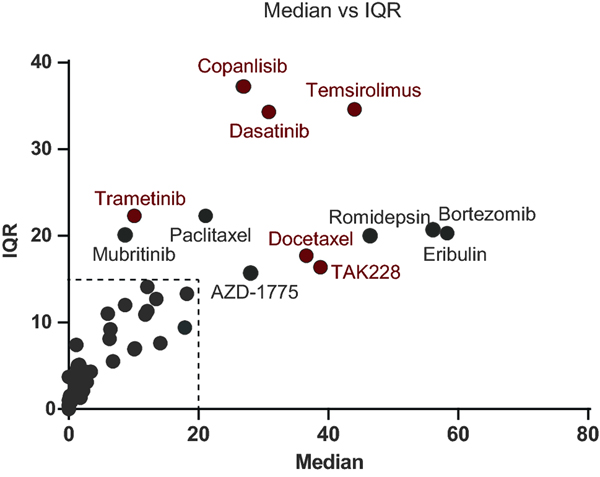
Figure 1. Selection of molecular correlate candidate drugs.
Twenty-three TNBC cell lines were treated with a panel of drugs yielding EC50 curves. The EC50s were used to derive DSS3 values. The IQR and Median DSS3 was plotted. Compounds with an IQR above 15 or median above 20 were prioritized, resulting in 12 drugs prioritized as molecular correlate targets. Correlations with molecular profiling yielded 6 sets of candidate molecular correlates (red).

