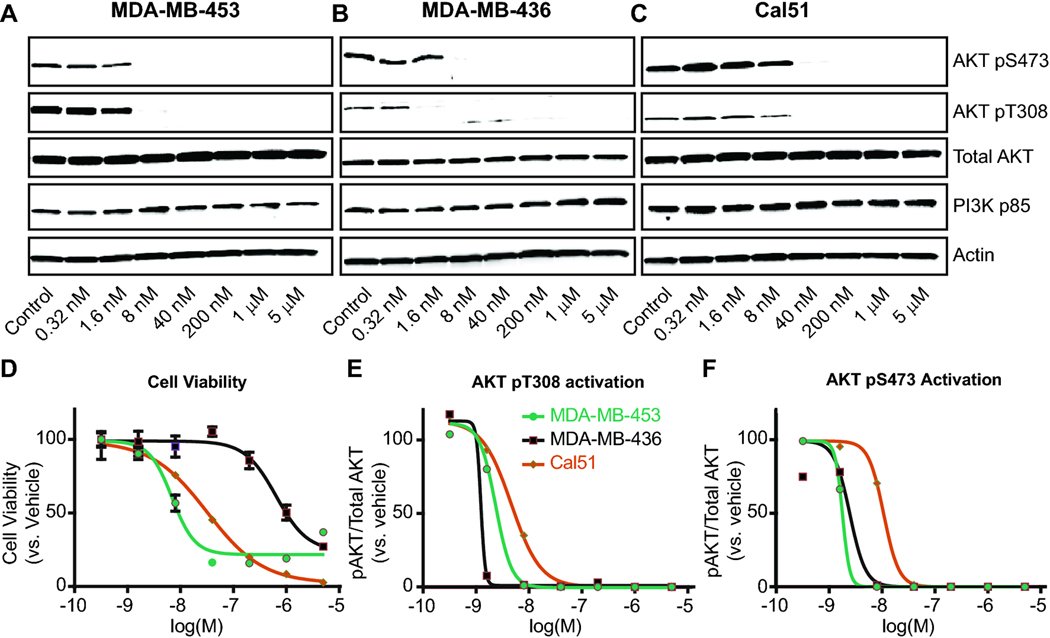
Figure 4. Downstream changes in PI3K signaling do not explain differences in DSS3 value.
Signaling measured following 2 h treatment with copanlisib at 5x increasing doses. Cell lines measured were A. MDA-MB-453, B. MDA-MB-436, C. Cal51. Key for D.-F. located in panel E. D. Cell viability curves for 72 h copanlisib treatment shows differential IC50 and cell death in the 3 cell lines. AKT activation is plotted for E. AKT pT308 and F. AKT pS473, calculated by densitometry for pAKT/Total AKT from A.-C.

