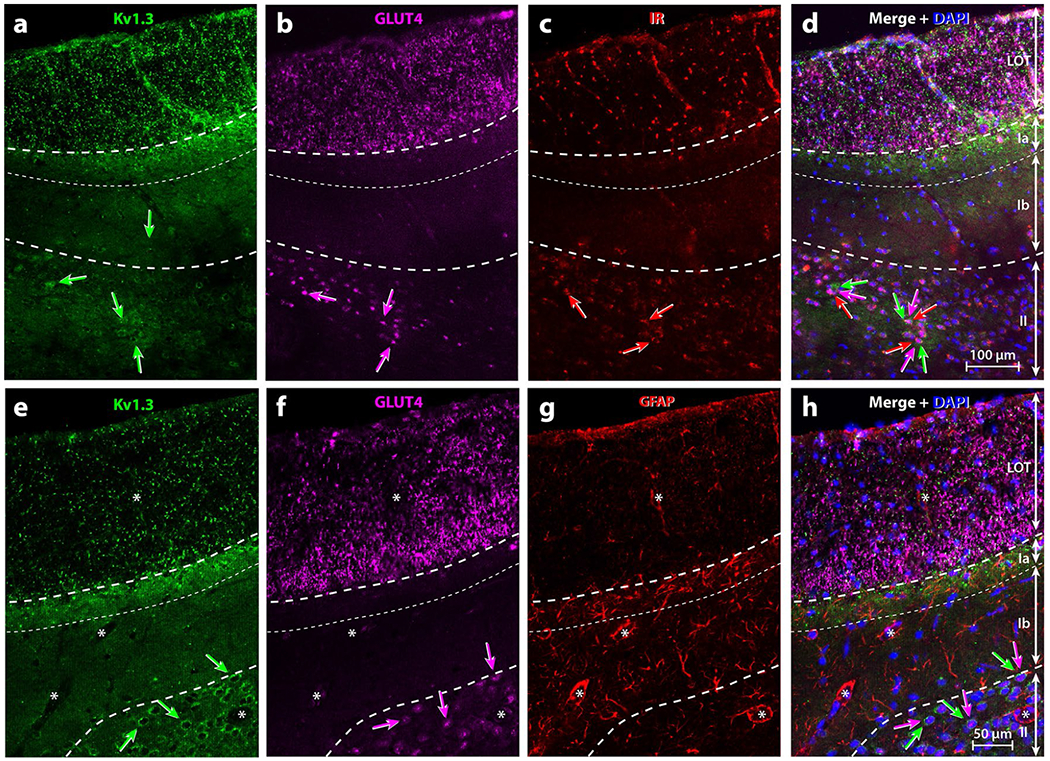
Fig. 4.

Representative triple-immunolabeling of metabolic signals within the rat anterior piriform cortex (aPCtx). Specific laminar location of (a, e) Kv1.3, (b, f) GLUT4, (c) IR, or (g) GFAP and their respective co-expression (Merge; d, h). Note: Kv1.3 and GLUT4 were abundant in the LOT while IR and GFAP labeling were less pronounced. Kv1.3 punctiform labeling was also present within Layer Ia where GFAP was more abundant. In Layer II, numerous neurons co-expressed Kv1.3, GLUT4 and IR (a–f, h; arrows with corresponding color) but not GFAP (g). Asterisks = blood vessels surrounded by GFAP-positive processes of astrocytes. DAPI blue nuclear stain; LOT lateral olfactory tract; Ia, Ib, II layers of the aPCtx delineated by dashed lines
