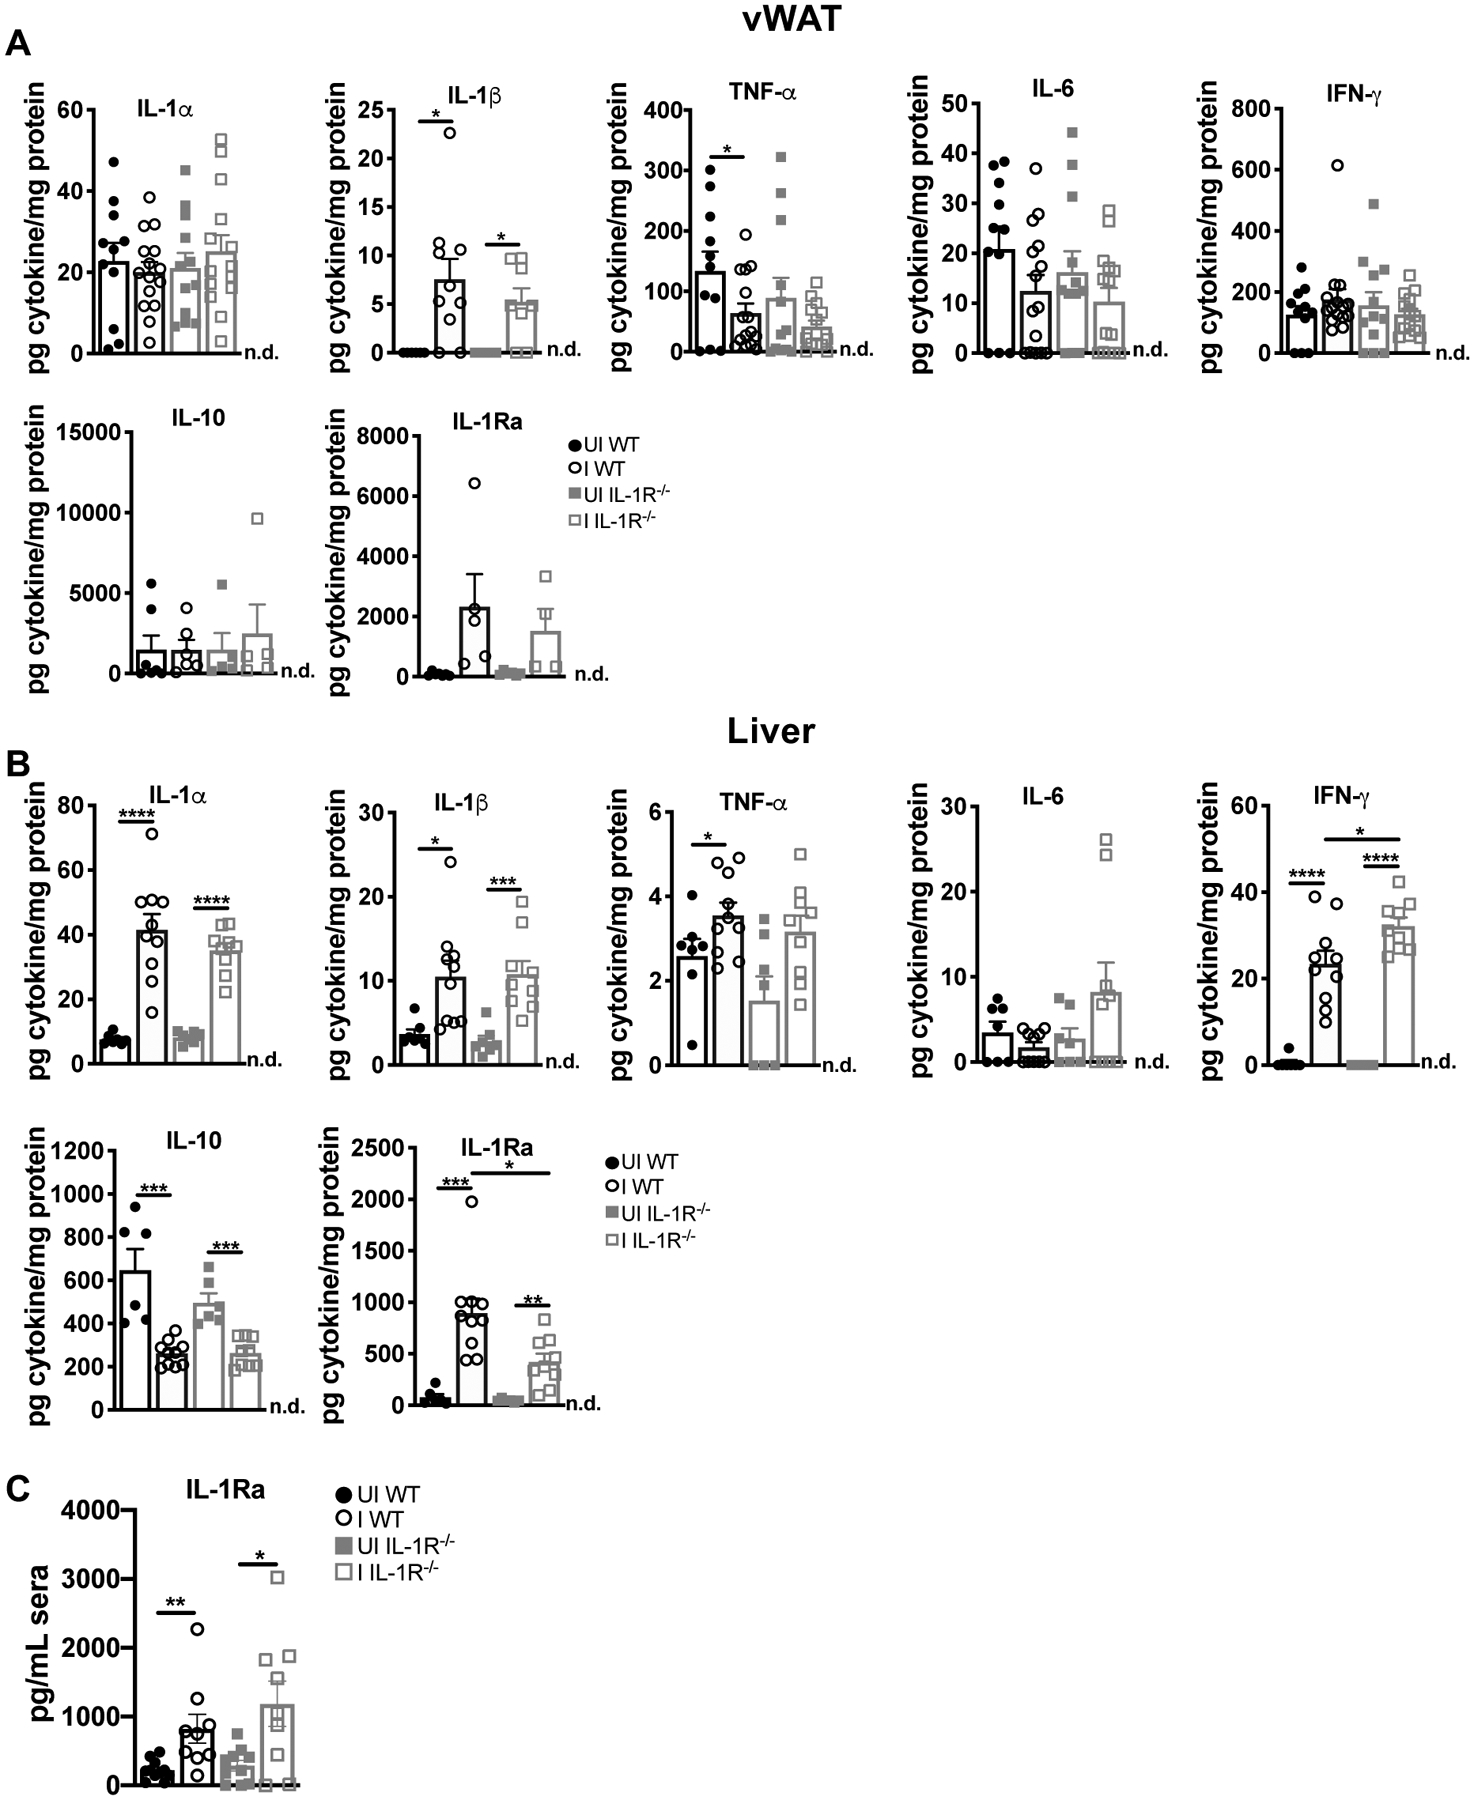
FIGURE 4.

IL-1R ligands are elevated in the liver and vWAT at 2 weeks post-infection. Cytokine concentration in tissue lysate were measured by ELISA in (A) vWAT (n = 5–15 mice per group, pooled from three experiments. IL-1β, IL-10, and IL-1Ra are from two experiments) or (B) liver (n = 7–10 mice per group, pooled from two experiments). n.d., not detectable. Data are shown as the mean ± SEM. *P < 0.05; **P < 0.01; ***P < 0.001, ****P<0.0001, n.s., not significant by unpaired Student’s T test.
