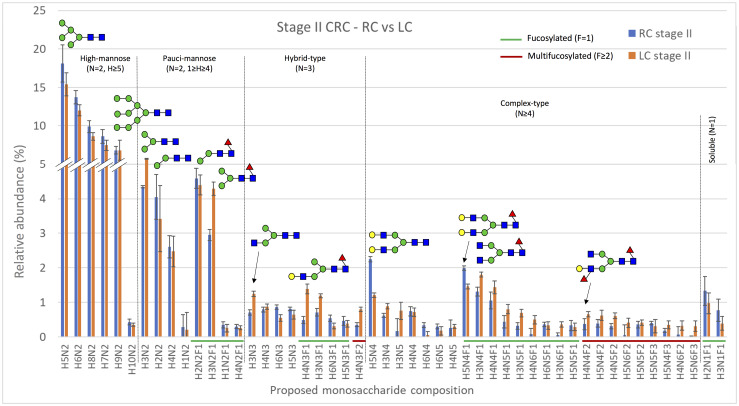
Fig 1. The relative abundance of the 50 most abundant neutral monosaccharide compositions in samples from patients with stage II cancer in the right (RC, blue bars, n = 9) or left (LC, orange bars, n = 9) colon.
The x-axis shows the proposed neutral N-glycan monosaccharide composition, where fucosylated and multifucosylated N-glycans are highlighted with green or red lines, respectively. The results are shown as means ± SEM. Several putative N-glycan structures are depicted using symbols, with green circles representing D-mannose, blue squares representing N-acetyl-D-glucosamine, red triangles representing L-fucose, and yellow circles representing D-galactose. Major structural subgroups are separated by a dotted line. H = hexose, N = N-acetylhexosamine, F = fucose. Schematic glycan drawings are proposed based on known glycan structures detected in CRC tissues [11] and they were not validated by structural analyses in the present study.

