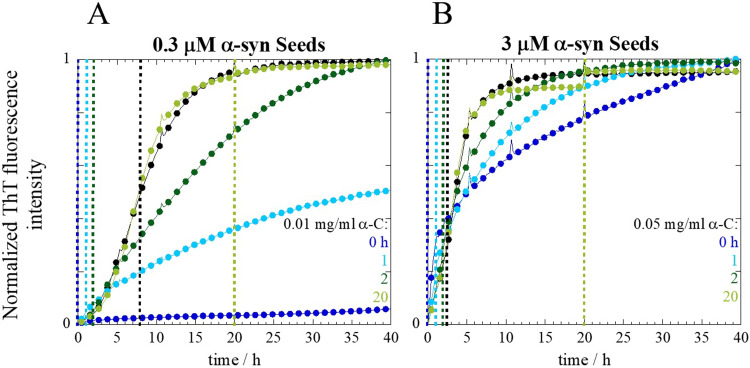
Fig 4. Aggregation kinetics of α-syn in the presence of α-crystallin added at different time points along the aggregation reaction.
Seeded aggregation kinetics was monitored using ThT for 20 μM α-syn alone (black traces) and in the presence of two different α-crystallin concentrations (A) 0.01 mg/ml and (B) 0.05 mg/ml in 10 mM MES buffer pH 5.5 under quiescent conditions at 37°C. α-Crystallin was added at different time points along the aggregation reaction, 0, 1, 2 and 20 h, indicated by vertical dashed lines with matching color code. The t1/2 is also indicated by a black dashed vertical line. The average of at least three experimental repeats is shown.

