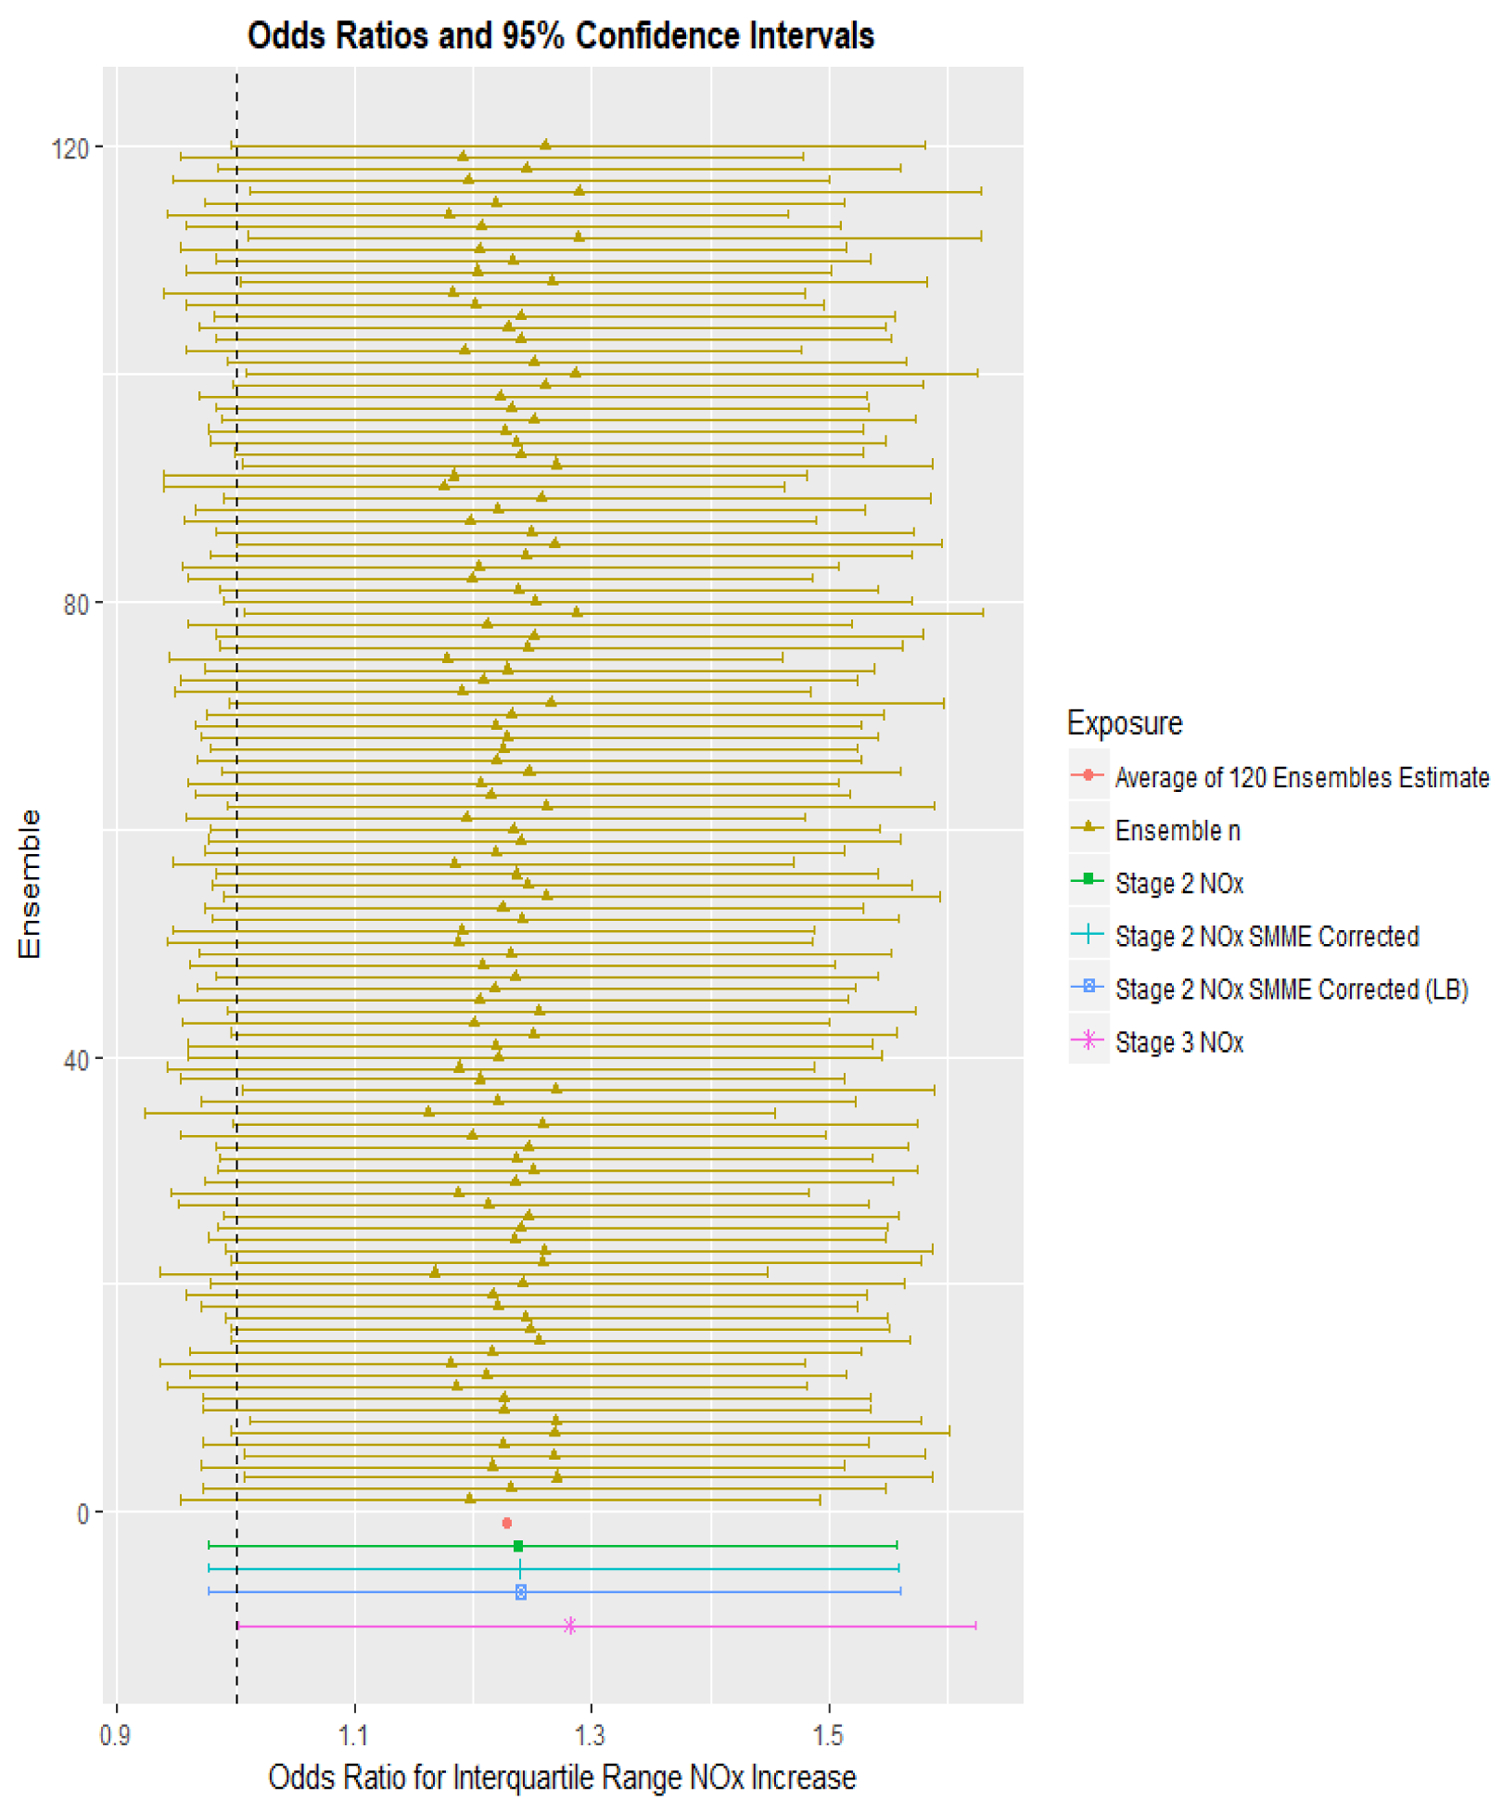
Figure 2:

Odds Ratio (OR, corrected for SMME where applicable) and 95% Confidence Interval (CI) of Recent Wheeze for an Interquartile Range Increase in Residential NOx Exposure as Estimated by the Different Stages (1–3) of the Li et al. (2017) [41] Spatiotemporal Model. Mixed-effect models were used to determine ORs and 95% CI for recent wheeze using exposure predictions from the individual 120 ensembles (yellow). The mean OR was calculated (red) to represent the average health effect estimate of stage 1 of the spatiotemporal model. Health models using stage 2 (green) and stage 3 (purple) NOx estimates were included for comparison. Health effect estimates from stage 2 corrected for SMME are shown in blue. All models were adjusted for maternal race, premature birth, child sex, baseline community, child age, child body mass index, maternal education, crowding in home, maternal and paternal allergy history.
