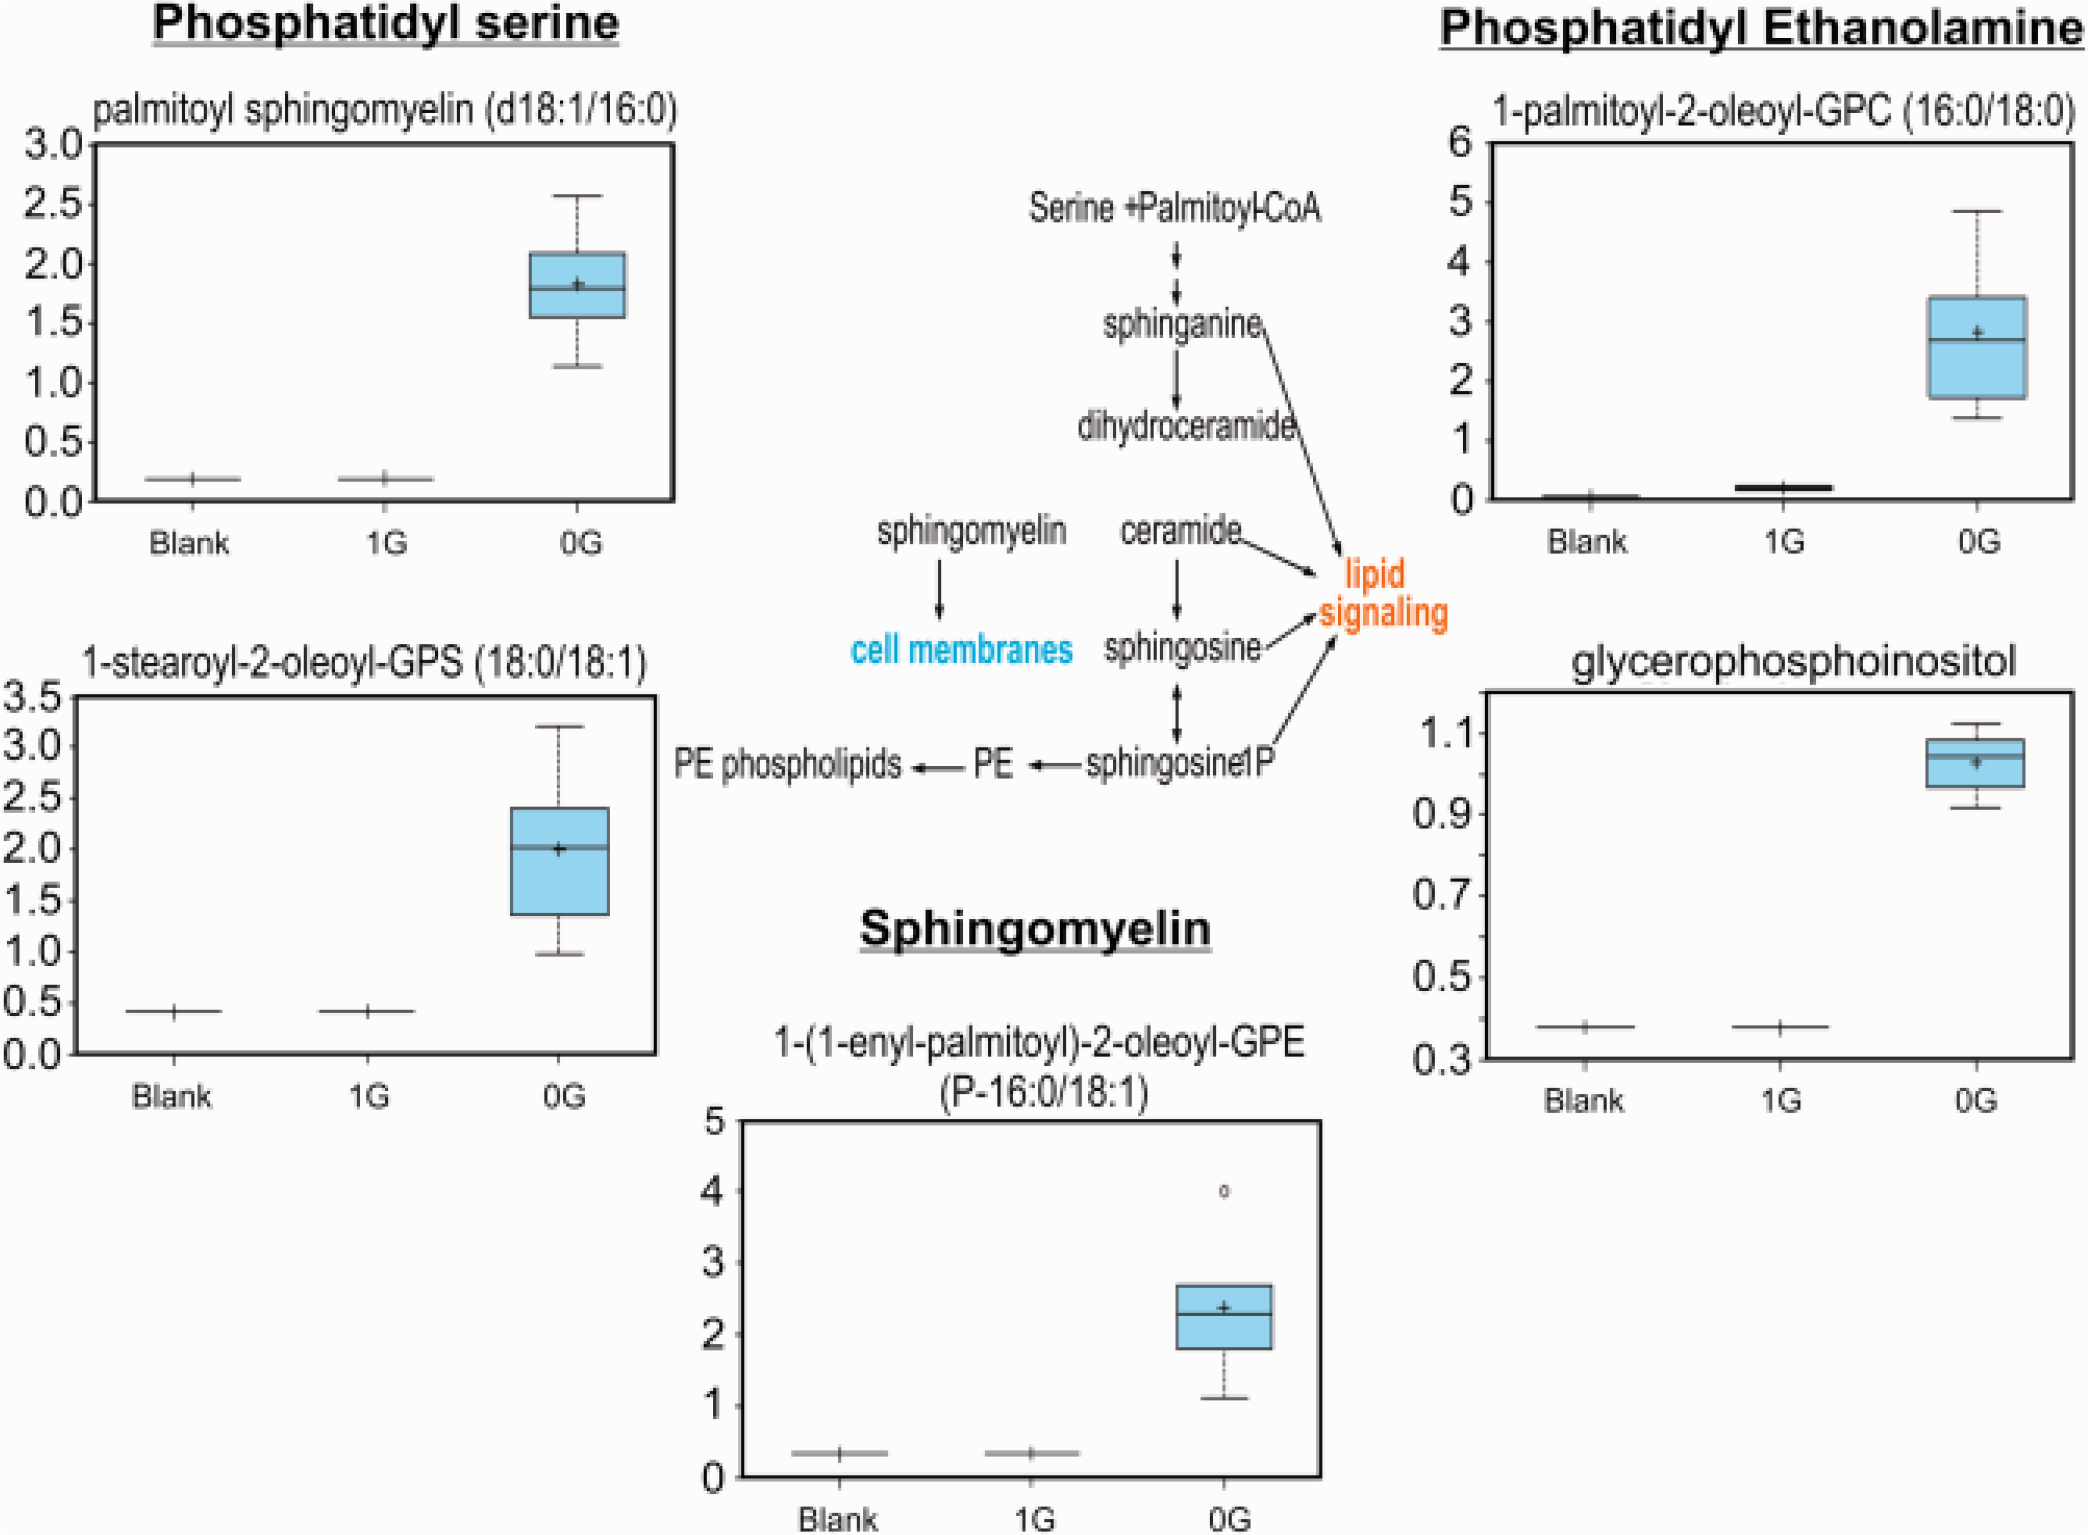
Fig. 8.

This basic overview of sphingolipid metabolism highlights the increase in palmitoyl and stearoyl sphingomyelins in the dataset, even if they are a lower-fold increase compared to N-palmitoyl-sphingosine, it complements the increases of lipids shown in Fig. 7 n = 5. Welch’s 2-factor t-test was used to identify significant changes in the metabolomic dataset, with a p<0.05 as a threshold for significance (and a trend value of 0.05<p<0.1). For box plots, whiskers reflect 5th and 95th percentiles (with the box displaying 25th to 75th quartiles); bisecting line represents the population median, while “+” represents population mean, for details see: (Weissgerber et al., 2015).
