
Figure 1: NLRP3 inflammasome is activated in FTD patients and Tau22 mice.
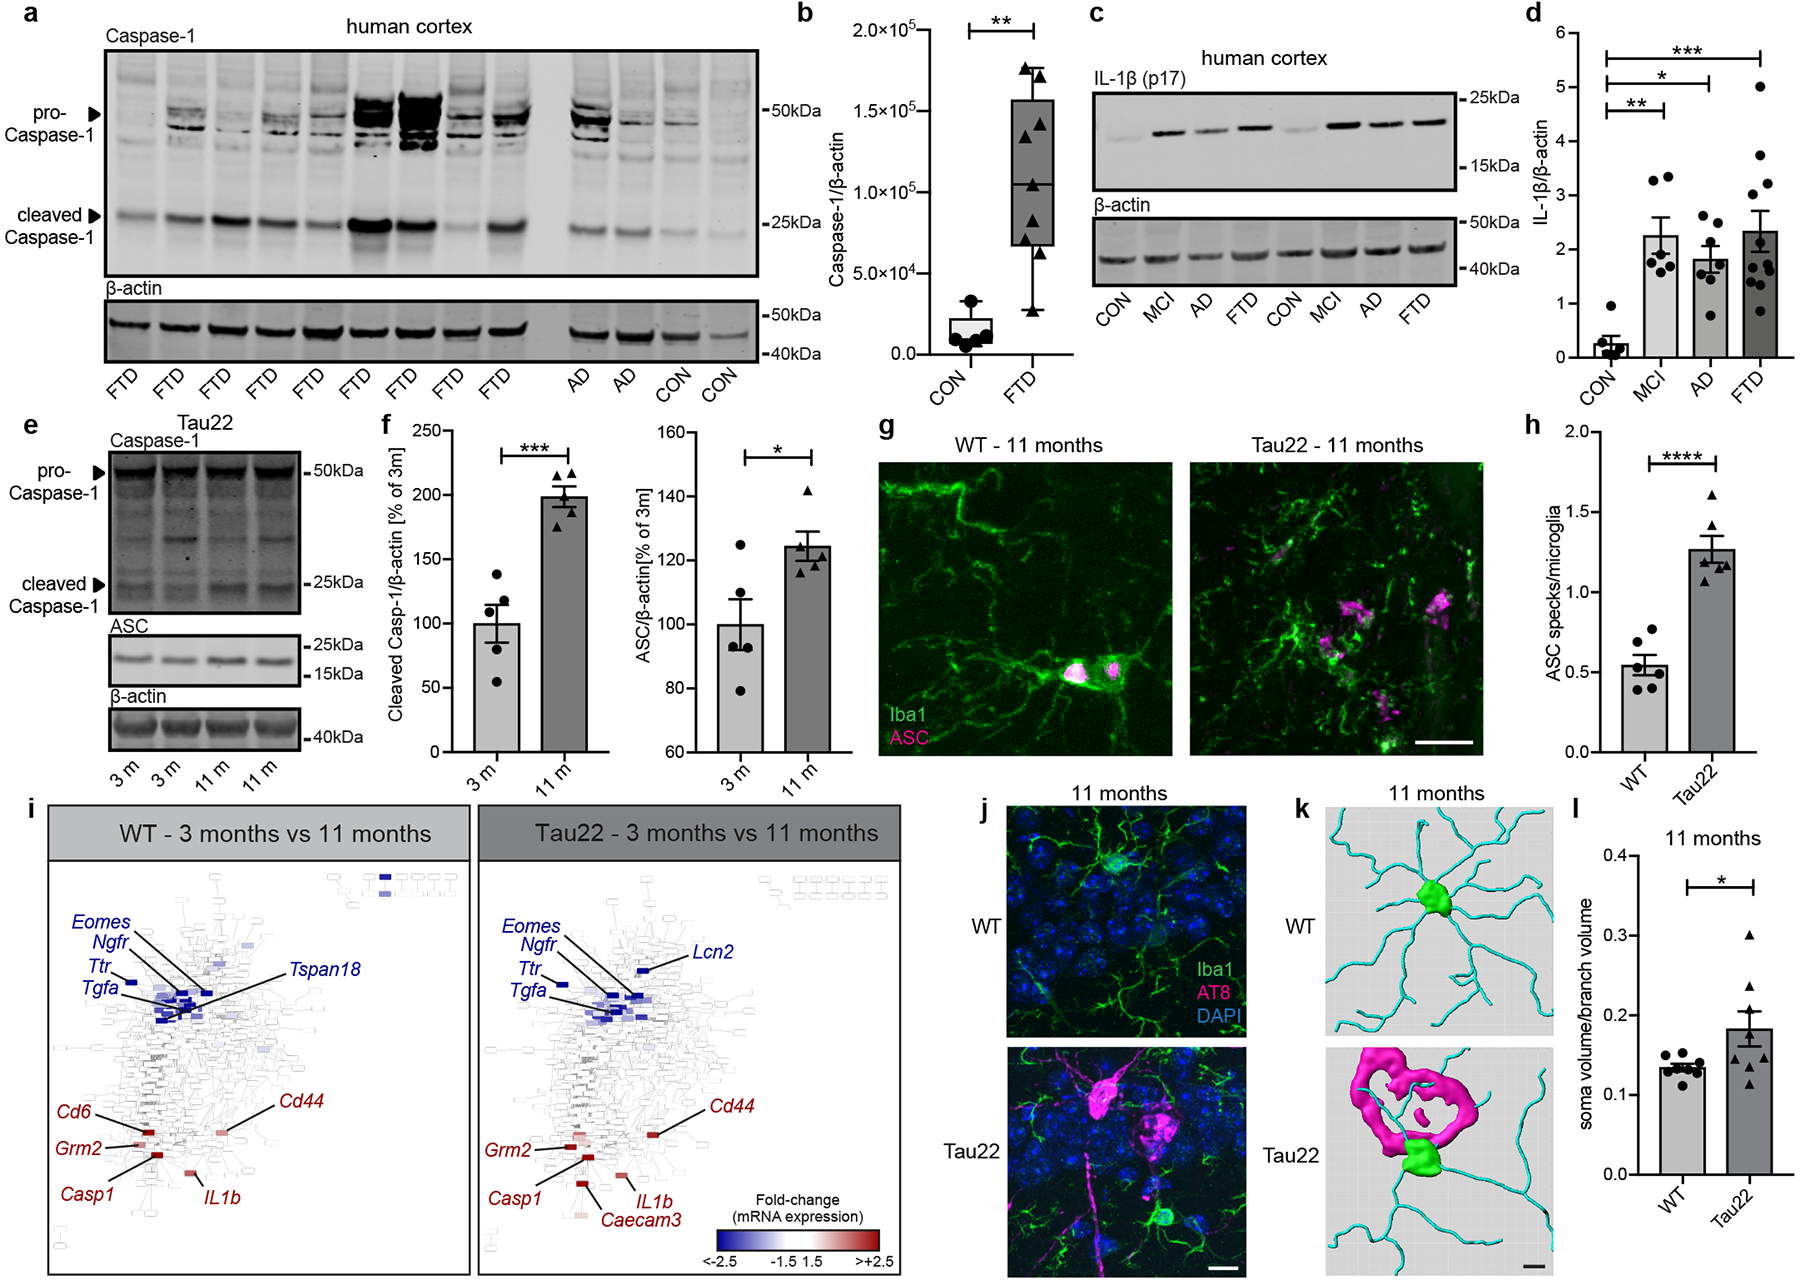
a, Immunoblot detection of Caspase-1 and β-actin in cortex of frontotemporal dementia patients (FTD), Alzheimer’s disease patients (AD) and controls (CON).
b, Quantification of CON and FTD data from a. Box plots show 25/75 percentile. n=5 for CON, n=9 for FTD, **P=0.0018.
c, Immunoblot analysis of IL-1β (p17) and β-actin in cortex of CON, mild cognitive impairment (MCI), AD and FTD patients.
d, Quantification of data from c. n=6 for CON and MCI, n=7 for AD, n=11 for FTD. **P=0.0049, *P=0.0269, ***P=0.0009.
e, Immunoblot detection of Caspase-1, ASC and β-actin in hippocampi of Tau22 mice (3 and 11 months).
f, Quantification of data from e. n=5, ***P=0.0004, *P=0.0281.
g, Immunohistochemical staining for microglia and ASC close to the CA1 region in WT and Tau22 mice. Scale bar, 10μm.
h, Quantification of ASC specks/microglia from staining in g. n=6, ****P<0.0001.
i, Gene network analysis of regulated genes at 3 vs. 11 months in WT and Tau22 mice identified by NanoString analysis.
j, Immunohistochemical staining for microglia and phosphorylated Tau (AT8) in WT and Tau22 mice. n=8. Scale bar, 10μm.
k, Reconstruction of microglia (green/blue) in WT and Tau22 mice close to an AT8-positive neuron (magenta). Scale bar, 20 μm.
l, Quantification of soma to branch volume of microglia located close to the CA1 region in WT or microglia in contact with AT8-positive cells in Tau22 mice. n=8, *P=0.0491.
For gel source data, see Supplementary Figure 1. Data are mean ± SEM and were analyzed by two-tailed unpaired t-test (b, f, h, l) or one-way ANOVA with Tukey’s test (d).