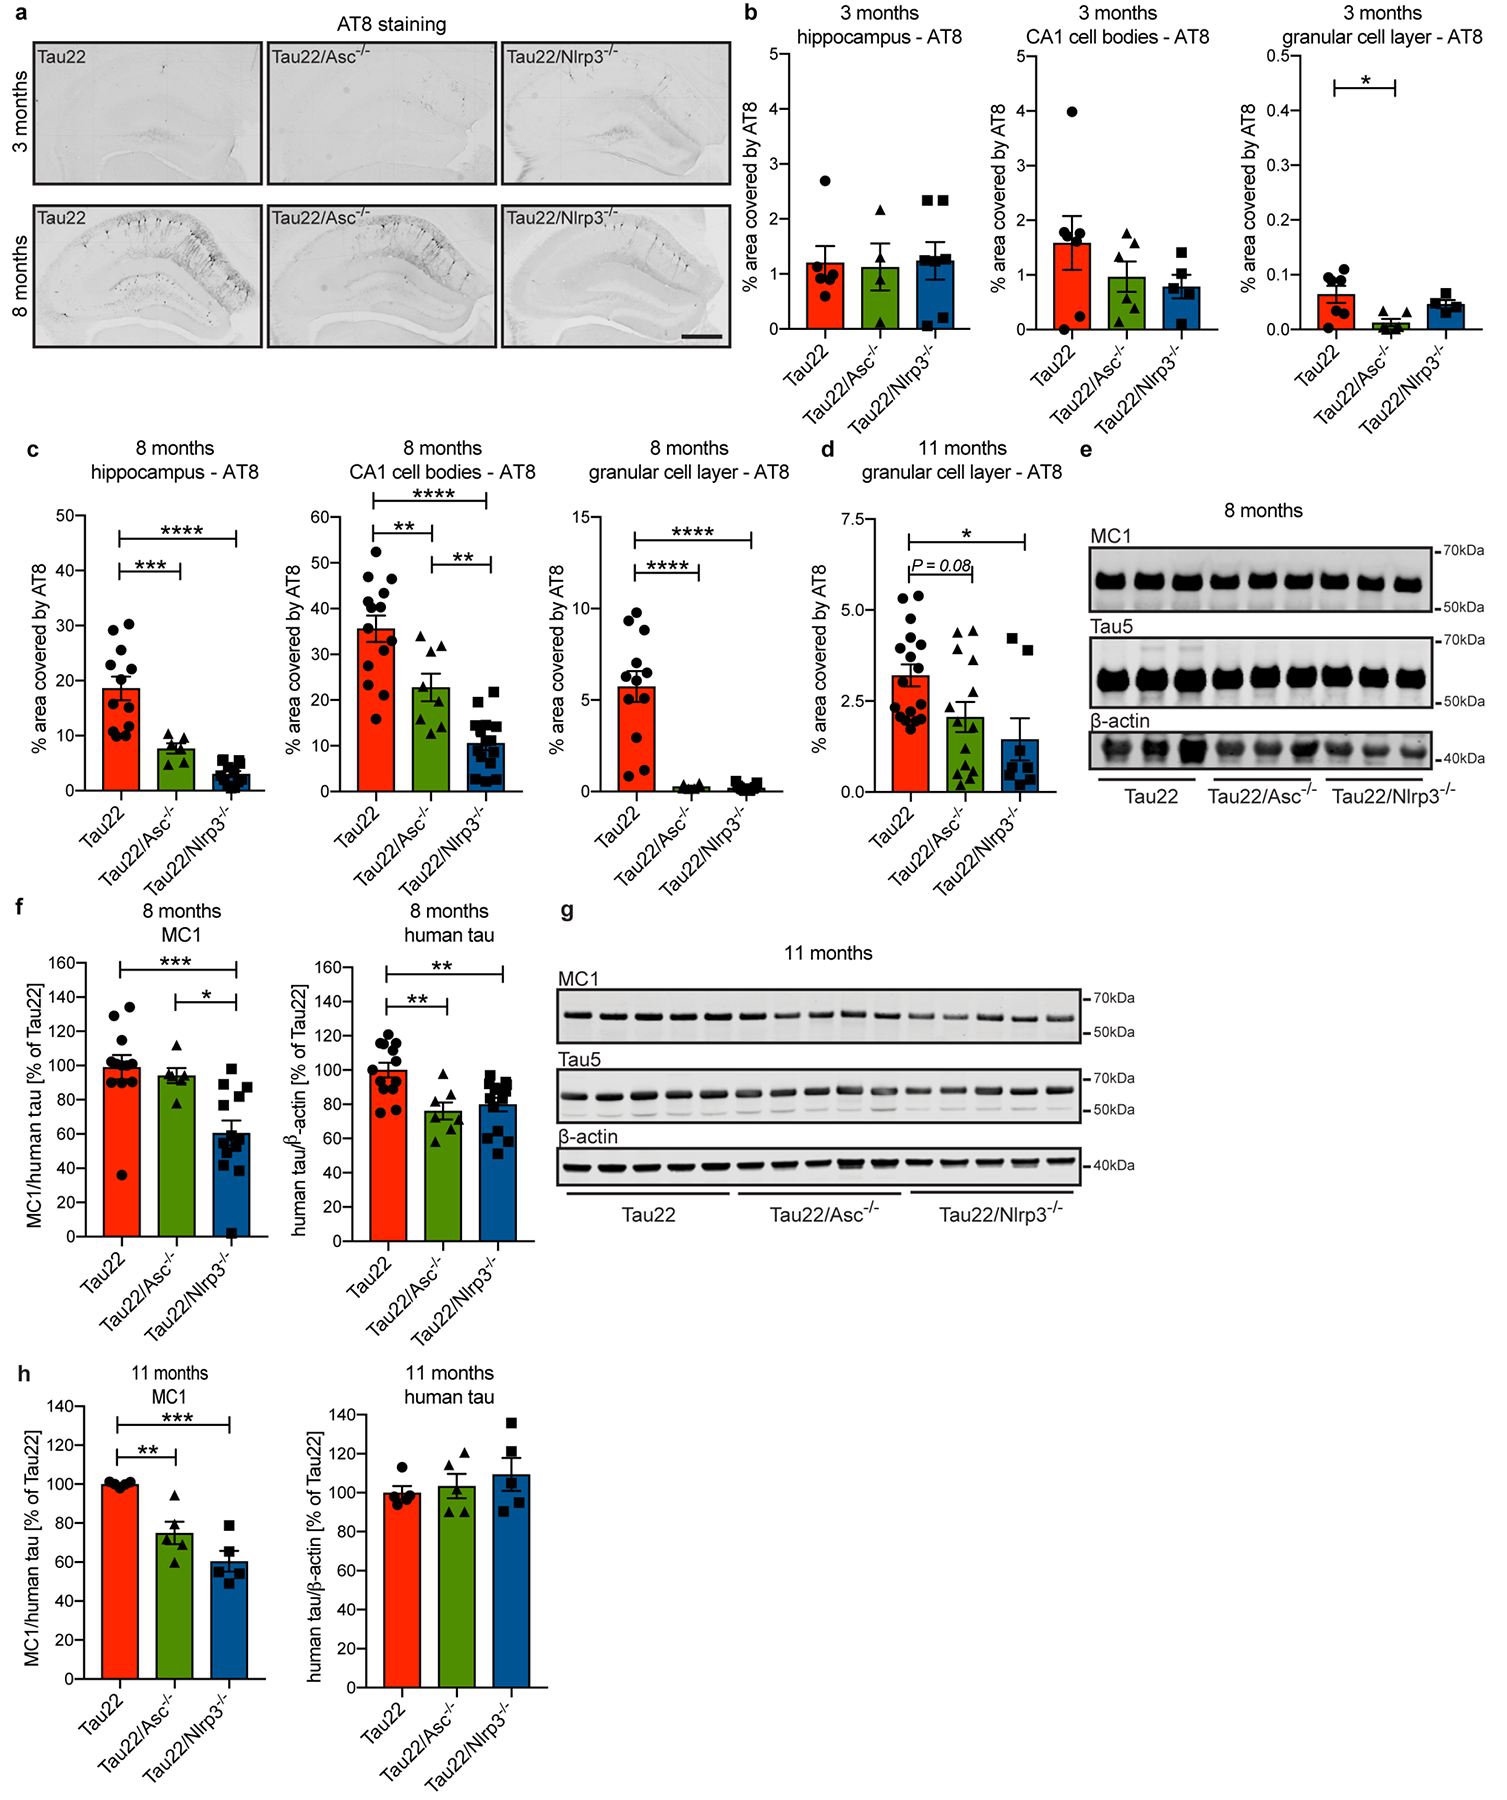
Extended Data Figure 6: Tau pathology is reduced in inflammasome-knockout mice.

a, Immunohistochemical staining for phosphorylated tau (AT8) in mouse hippocampi. Scale bar, 500μm.
b, Quantification of AT8 in hippocampus, CA1 cell body layer and granular cell layer in the dentate gyrus of 3 month old mice shown in a (n=6 for hippocampus Tau22 and CA1 and dentate gyrus Tau22/Asc−/−, n=4 for hippocampus Tau22/Asc−/− and dentate gyrus Tau22/Nlrp3−/−, n=7 for hippocampus Tau22/Nlrp3−/− and CA1 and dentate gyrus Tau22, n=5 for CA1 Tau22/Nlrp3−/−. *P=0.0181.
c, Quantification of AT8 in hippocampus, CA1 cell body layer and granular cell layer in the dentate gyrus of 8 month old mice shown in a. Hippocampus: n=12 for Tau22, n=6 for Tau22/Asc−/−, n=13 for Tau22/Nlrp3−/−. ***P=0.0004 and ****P<0.0001. CA1: n=14 for Tau22, n=8 for Tau22/Asc−/−, n=15 for Tau22/Nlrp3−/−.Tau22 vs. Tau22/Asc−/−: **P=0.0052, Tau22 vs. Tau22/Nlrp3−/−: ****P<0.0001, Tau22/Asc−/−: vs. Tau22/Nlrp3−/−: **P=0.0075. Dentate gyrus: n=12 for Tau22, n=6 for Tau22/Asc−/−, n=13 for Tau22/Nlrp3−/−), ****P<0.0001.
d, Quantification of AT8 in granular cell layer in the dentate gyrus of 11 month old mice shown in Fig. 2a. n=17 for Tau22, n=14 for Tau22/Asc−/−, n=8 for Tau22/Nlrp3−/−, *P=0.0196.
e, Immunoblot analysis of sarkosyl-soluble fraction of hippocampi from 8 month old Tau22, Tau22/Asc−/− and Tau22/Nlrp3−/− mice stained for misfolded tau (MC1), total tau (Tau5) and β-actin.
f, Quantification of data from e. MC1: n=12 for Tau22, n=6 for Tau22/Asc−/−, n=13 for Tau22/Nlrp3−/− with Tau22 vs. Tau22/Nlrp3−/−: ***P=0.0009 and Tau22/Asc−/− vs. Tau22/Nlrp3−/−: *P=0.0190. Human tau: n=13 for Tau22, n=7 for Tau22/Asc−/−, n=14 for Tau22/Nlrp3−/−. Tau22 vs. Tau22/Asc−/−: **P=0.0047, Tau22 vs. Tau22/Asc−/−: **P=0.0037.
g, Immunoblot detection of misfolded tau (MC1), total tau (Tau5) and β-actin in sarkosyl-soluble fraction of mouse hippocampi at 11 months of age.
h, Quantification of data from g. n=5, **P=0.0056, ***P=0.0001.
For gel source data, see Supplementary Figure 1. All graphs are presented as mean ± SEM and were analyzed by one-way ANOVA followed by Tukey’s test.
