
Extended Data Figure 7: Microglia and astrocyte numbers are unaltered in Tau22/Asc−/− and Tau22/Nlrp3−/− mice.
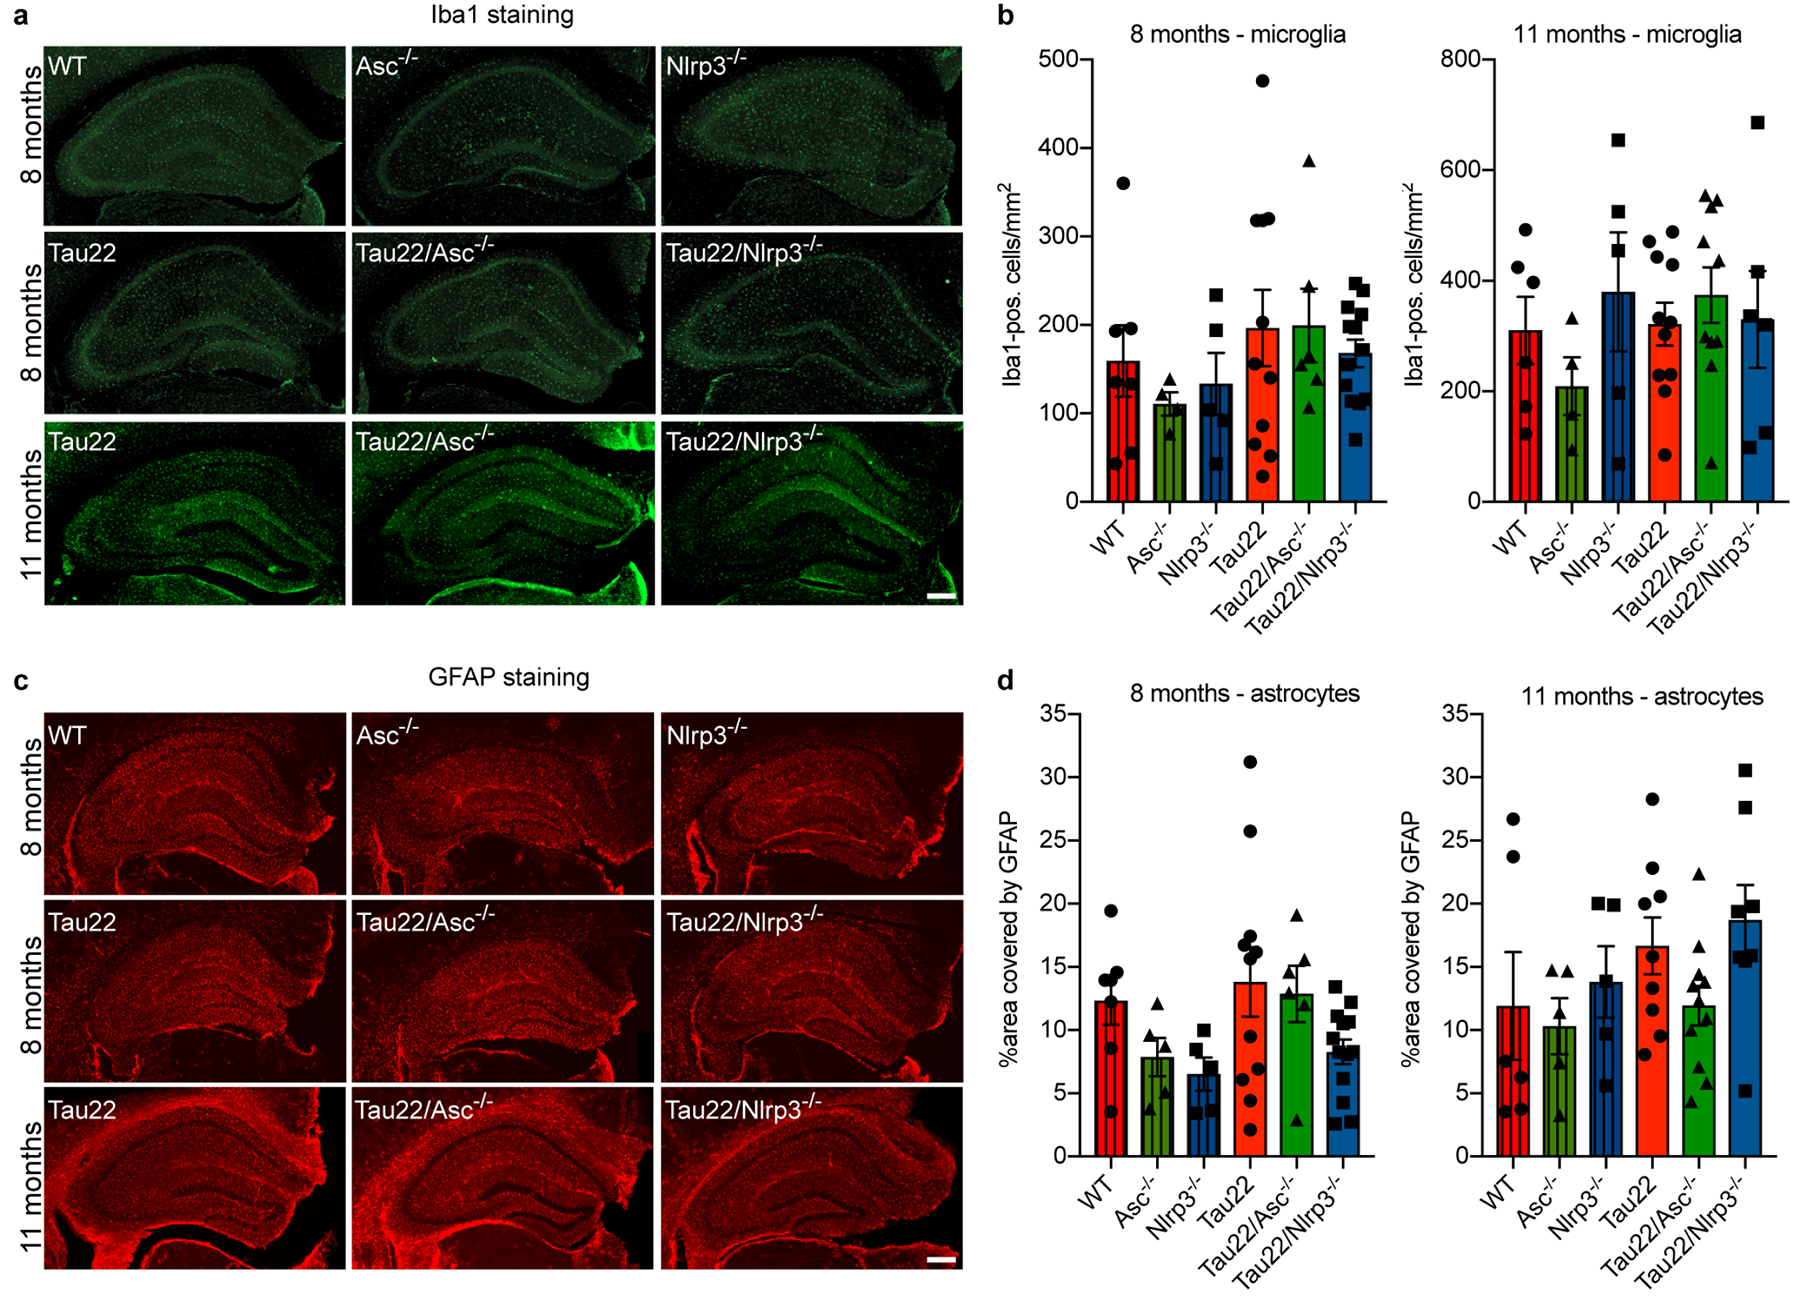
a, Immunohistochemical staining of hippocampus of mice with the indicated genotypes and at the indicated ages for microglia (Iba1). Scale bar, 250μm.
b, Quantification of Iba1-positive cells in the hippocampus as seen in a at 8 (left) and 11 months of age (right). n=7 for 8 months WT, n=6 for 11 months WT, n=4 for 8 and 11 months Asc−/−, n=5 for 8 and 11 months Nlrp3−/−, n=11 for 8 and 11 months Tau22, n=6 for 8 months Tau22/Asc−/−, n=10 for 11 months Tau22/Asc−/−, n=13 for 8 months Tau22/Nlrp3−/−, n=6 for 11 months Tau22/Nlrp3−/−.
c, Immunohistochemical staining of hippocampus of mice with the indicated genotypes and at the indicated ages for astrocytes (GFAP). Scale bar, 250μm.
d, Quantification of GFAP in the hippocampus as seen in c at 8 (left) and 11 months of age (right). n=7 for 8 months WT, n=6 for 11 months WT, n=5 for 8 and 11 months Asc−/− and Nlrp3−/−, n=11 for 8 months Tau22, n=9 for 11 months Tau22, n=6 for 8 months Tau22/Asc−/−, n=11 for 11 months Tau22/Asc−/−, n=13 for 8 months Tau22/Nlrp3−/−, n=8 for 11 months Tau22/Nlrp3−/−).
For gel source data, see Supplementary Figure 1. All graphs are presented as mean ± SEM and were analyzed by one-way ANOVA followed by Tukey’s test.