
Figure 2: Loss of NLRP3 inflammasome function decreases tau pathology and improves cognition.
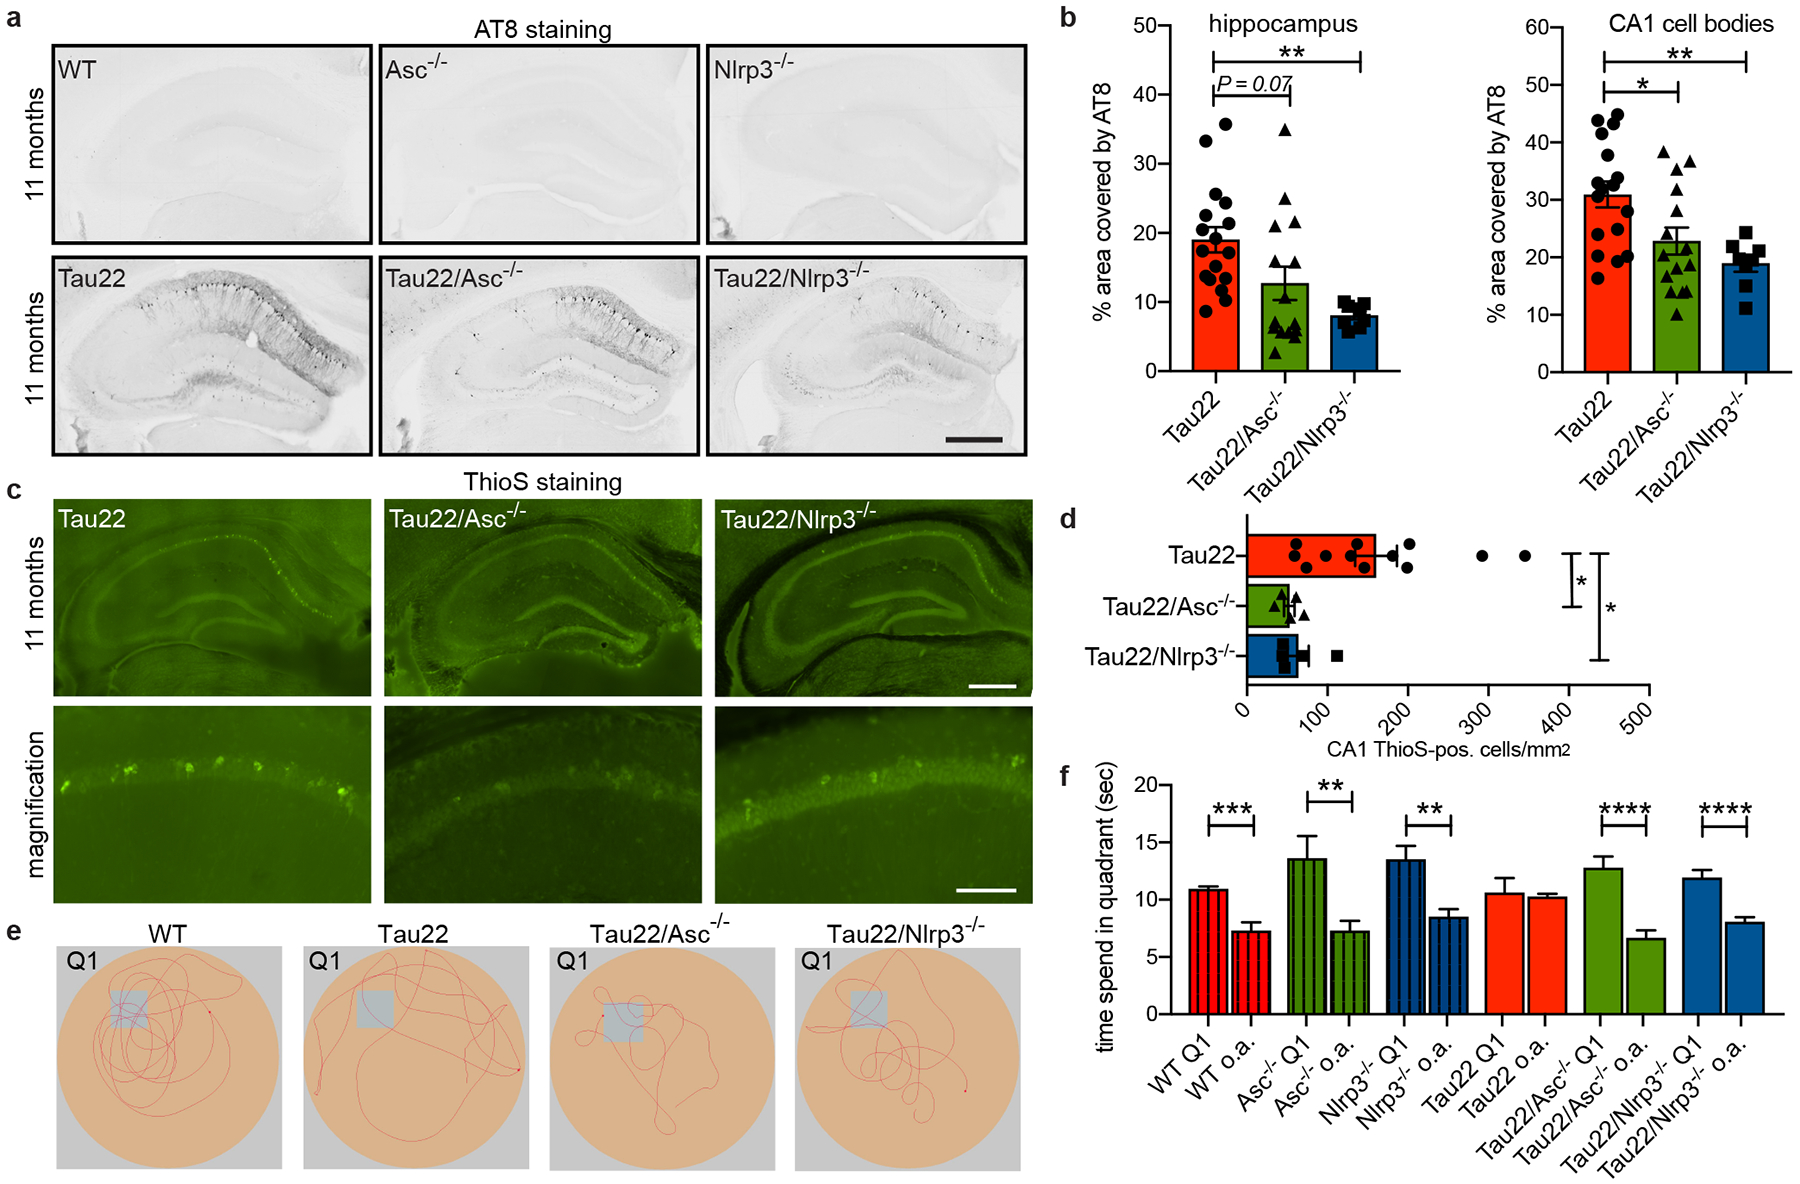
a, Immunohistochemical staining for phosphorylated tau (AT8) in mouse hippocampi. Scale bar, 500μm.
b, Quantification of AT8 in hippocampus and CA1 region shown in a. n=17 for Tau22, n=15 for Tau22/Asc−/−, n=8 for Tau22/Nlrp3−/−. Hippocampus: **P=0.0055, CA1: *P=0.0278, **P=0.0059.
c, Staining with thioflavine S (aggregated Tau) of mouse hippocampi. Scale bar, 500μm (top) and 100μm (bottom).
d, Quantification of thioflavine S-positive cells in CA1 region shown in c. n=12 for Tau22, n=5 for Tau22/Asc−/− and Tau22/Nlrp3−/−. Tau22 vs. Tau22/Asc−/−: *P=0.0240, Tau22 vs. Tau22/Nlrp3−/−: *P=0.0444.
e, Example of movement of mice in Morris water maze test (MWM).
f, Quantification of time spend in quadrant 1 (Q1) vs. all other quadrants (a.o.) in MWM. n=12 for WT, Nlrp3−/−, Tau22/Asc−/−, Tau22/Nlrp3−/−, n=14 for Asc−/−, n=16 for Tau22. ***P=0.0001, ****P<0.0001, Asc−/−: **P=0.0065, Nlrp3−/−: **P=0.0012. For gel source data, see Supplementary Figure 1. Data are mean ± SEM and were analyzed by one-way ANOVA with Tukey’s test (b, d) or two-tailed unpaired t-test (f).