
Figure 4: Inflammasome function is necessary for Aβ-induced tau pathology.
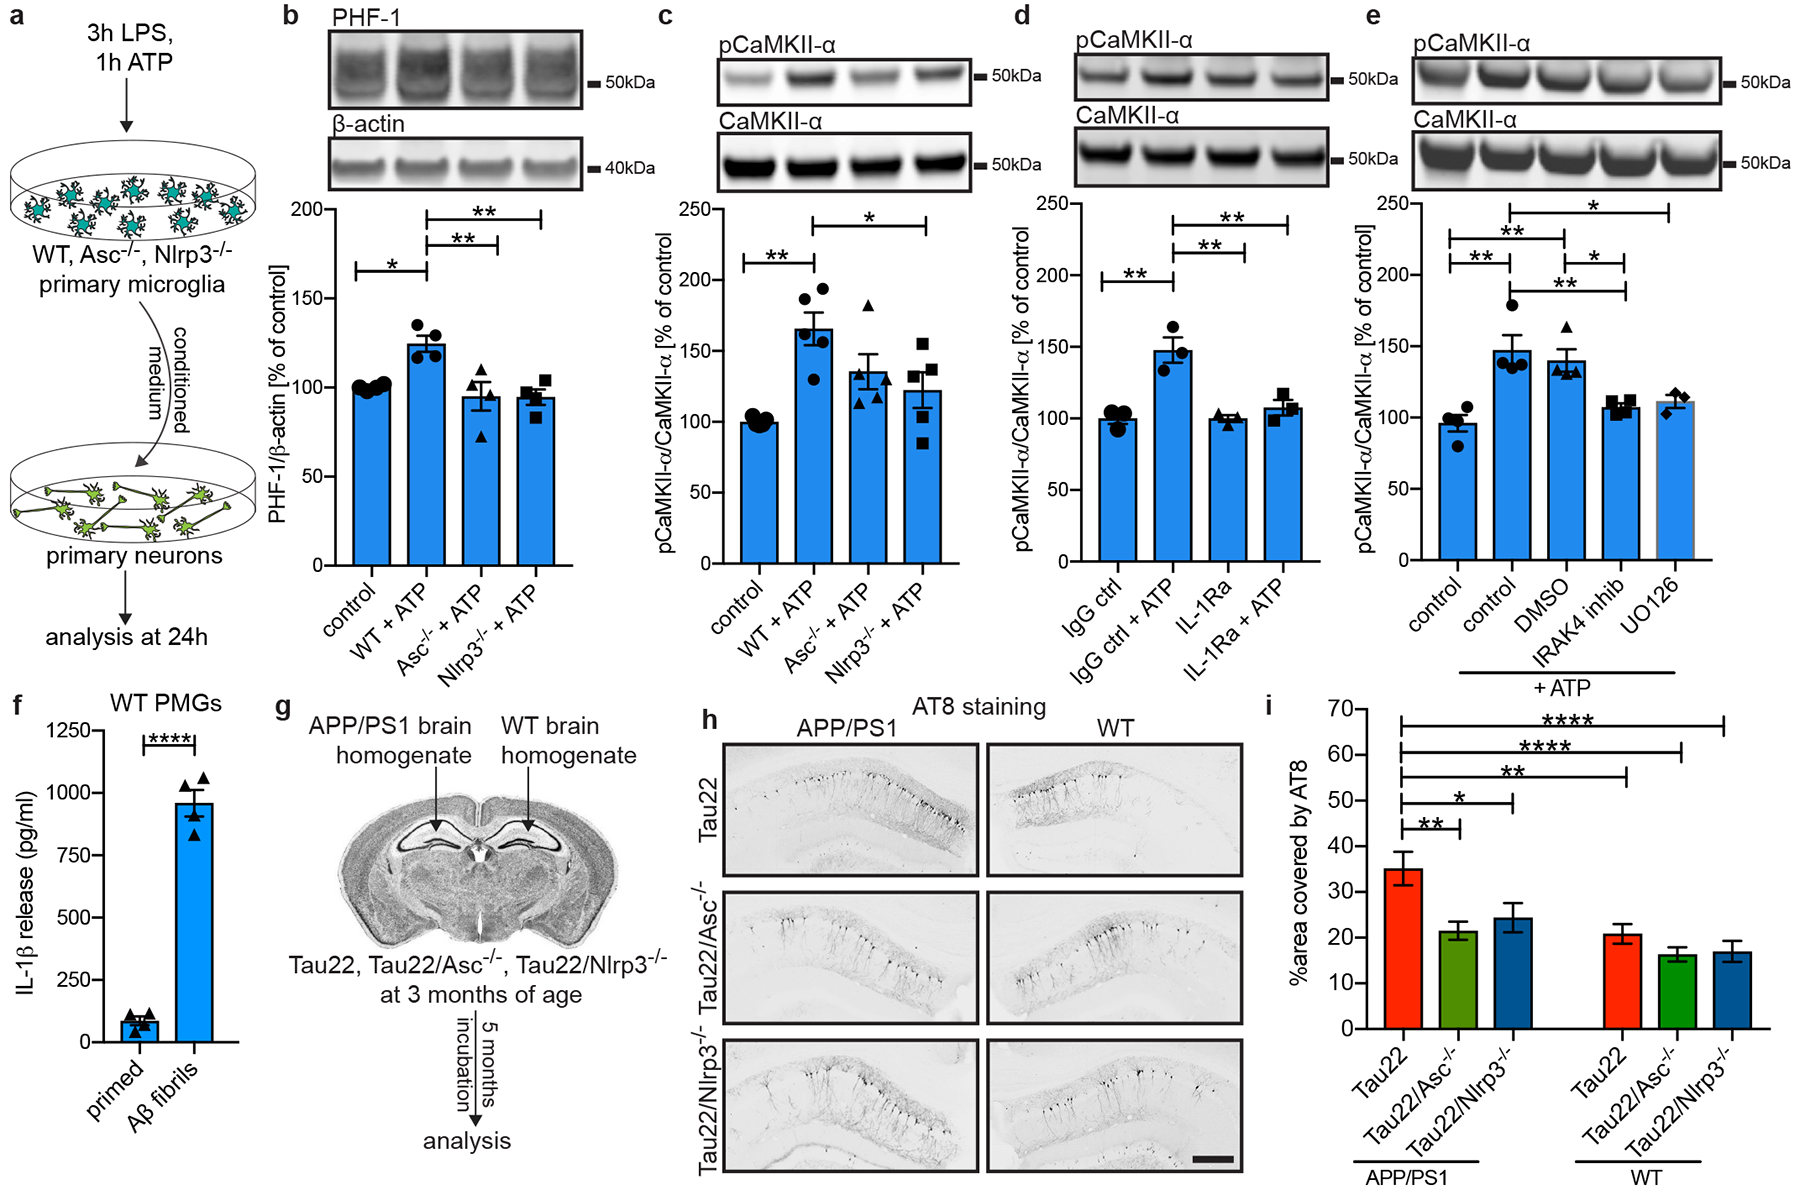
a, Schematic illustrating the experimental set-up used for experiments shown in b - e.
b - c, Immunoblot analysis and quantification of tau phosphorylated at Ser396/Ser404 (PHF-1) and pCaMKII-α in treated neurons (primary WT microglia (control), LPS+ATP-activated WT microglia (WT+ATP), LPS+ATP-activated Asc- or Nlrp3-knockout microglia (Asc−/−+ATP or Nlrp3−/−+ATP)). n=4 in b, with ctrl vs. WT+ATP: *P=0.0235, WT+ATP vs. Asc−/−+ATP: **P=0.0072, WT+ATP vs. Nlrp3−/−+ATP: **P=0.0064. n=5 in c with **P=0.0022, *P=0.0454.
d, Immunoblot analysis and quantification of pCaMKII-α in neurons treated with an IL-1 receptor antagonist (IL-1Ra) or the corresponding isotype control in addition to conditioned medium from WT microglia. n=3, IgG ctrl vs. IgG ctrl+ATP and vs. IL-1ra: **P=0.0015, IgG ctrl+ATP vs. IL-1ra+ATP: **P=0.0044.
e, Immunoblot analysis and quantification of pCaMKII-α in neurons after treatment with DMSO, IRAK4 inhibitor PF06650833 or MEK1/2 inhibitor UO126 in addition to conditioned medium from WT microglia. n=3 for UO126, n=4 for all other groups, ctrl vs. ctrl+ATP: **P=0.0011, ctrl vs. DMSO+ATP: **P=0.0040, ctrl+ATP vs. IRAK4 inhib+ATP: **P=0.0087, ctrl+ATP vs. UO126+ATP: *P=0.0309, DMSO+ATP vs. IRAK4 inhibitor: *P=0.0338.
f, IL-1β levels in conditioned medium of primary WT microglia treated with LPS and 10μM Aβ fibrils. n=4, ****P<0.0001.
g, Schematic for injection model.
h, Immunohistochemical staining for phosphorylated tau (AT8) of CA1 region of mice injected with either APP/PS1 or WT brain homogenates. Scale bar, 250μm.
i, Quantification of AT8 in CA1 region of injected mice shown in h. n=17 sections of n=6 mice for Tau22, n=30 sections of n=6 mice for Tau22/Asc−/−, n=25 sections of n=6 mice for Tau22/Nlrp3−/−. *P=0.0490, ****P<0.0001, Tau22+APP/PS1 vs. Tau22/Asc−/−+APP/PS1: **P=0.0034, Tau22+APP/PS1 vs. Tau22+WT: **P=0.0071. For gel source data, see Supplementary Figure 1. Data are mean ± SEM and were analyzed by one-way ANOVA with Tukey’s test (b-e, i) or two-tailed unpaired t-test (f).