
Extended Data Figure 1. The NLRP3 inflammasome is activated in Tau22 mice.
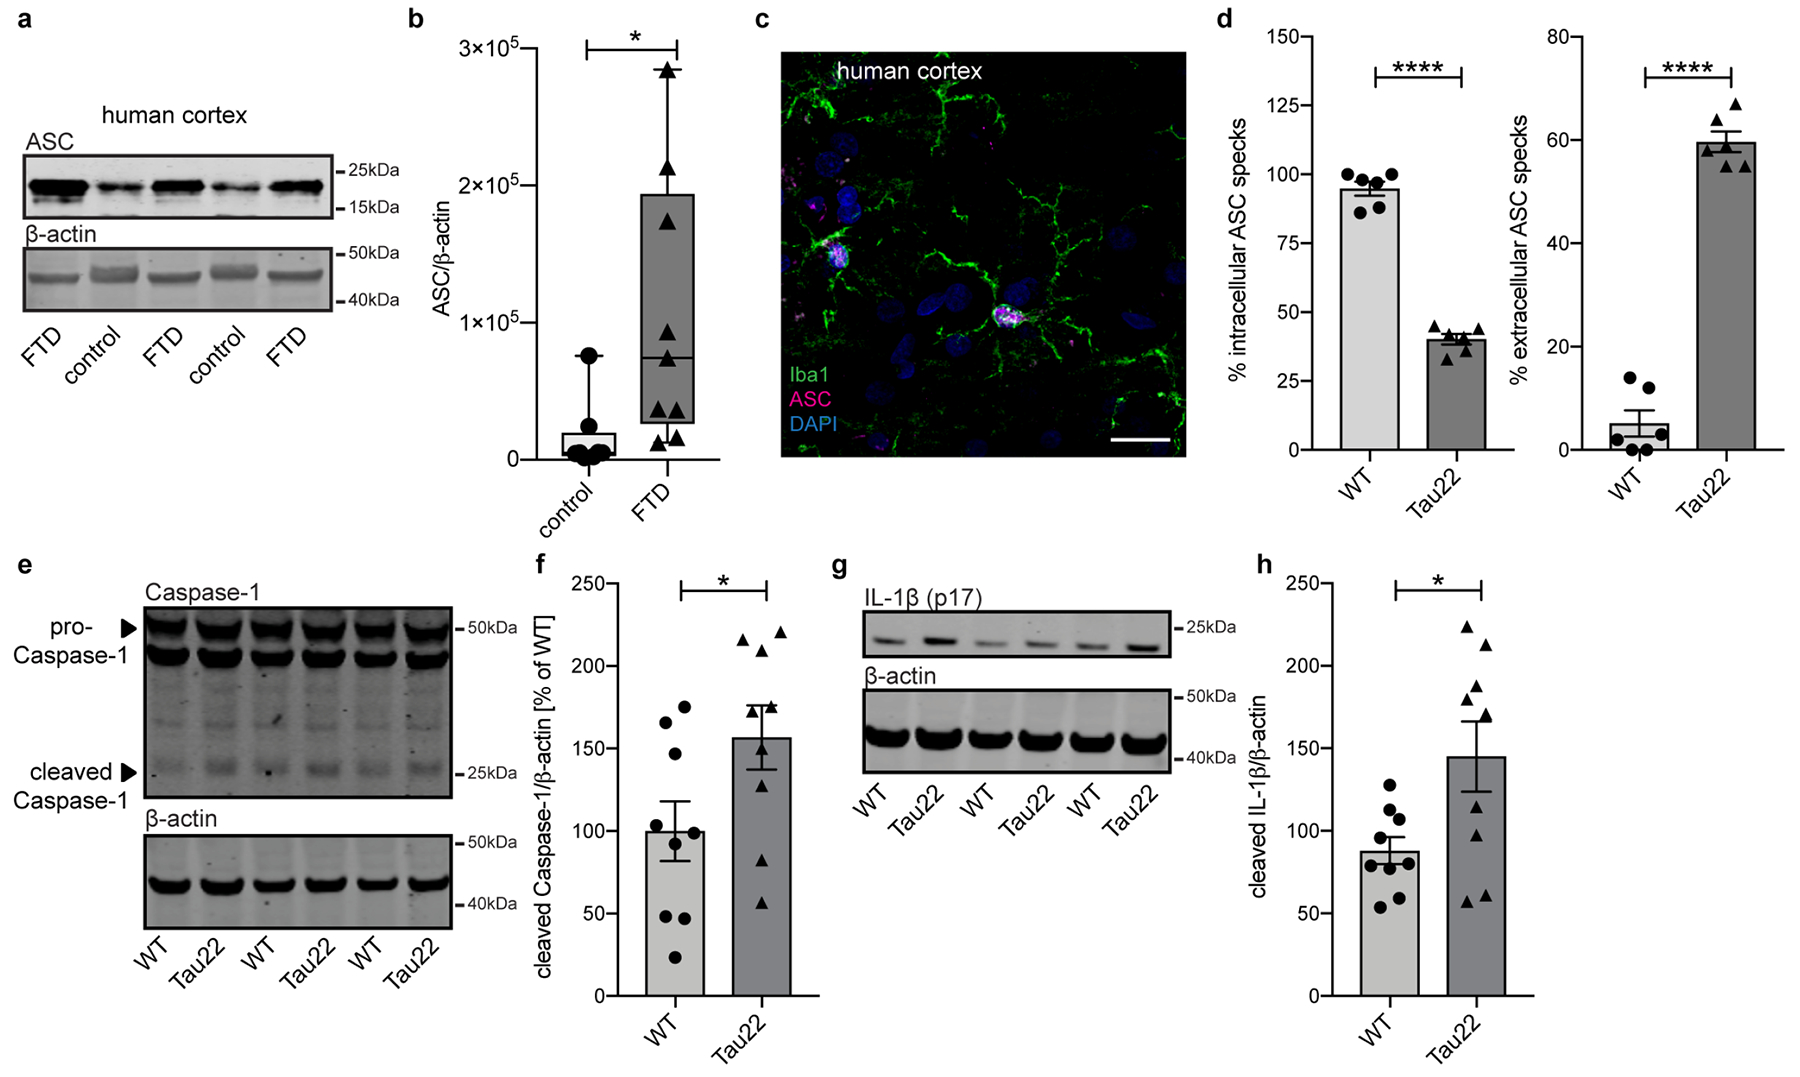
a, Immunoblot analysis of ASC and β-actin in human cortex of FTD and control patients.
b, Quantification of data from a. Box plots show 25/75 percentile. n=8 for controls, n=9 for FTD, *P=0.0239.
c, Immunohistochemical staining of human cortex of a FTD patient for microglia and ASC. n=3. Scale bar, 20μm.
d, Quantification of % of intracellular ASC and % of extracellular ASC specks from staining shown in Fig 1g. n=6 mice per group, ****P<0.0001.
e, Immunoblot analysis of hippocampus samples of 8 month old wildtype (WT) and Tau22 mice stained for Caspase-1 and β-actin.
f, Quantification of data from e. n=9 per group, *P=0.0489.
g, Immunoblot analysis of hippocampus samples of 8 month old WT and Tau22 mice stained for IL-1β (p17) and β-actin.
h, Quantification of data from g. n=9 per group, *P=0.0236.
For gel source data, see Supplementary Figure 1. All graphs are presented as mean ± SEM and were analyzed by two-tailed unpaired t-test.