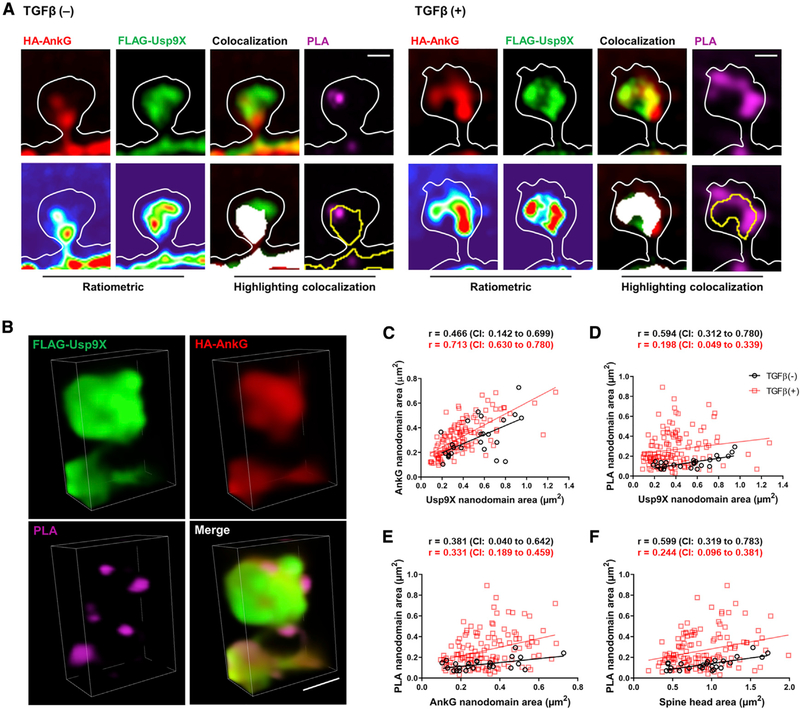
Figure 5. TGF-β-Mediated Phosphorylation of Usp9X Regulates Spine Morphogenesis through Interaction with Ankyrin-G.
(A and B) SIM images of a spine (A) from FLAG-Usp9XWt in Figure 4C. Lower panels show ratiometric images and colocalization (white). Scale bar, 0.5 μm. 3D reconstruction (B) of a PLA-SIM image of a spine from TGF-β (+). Scale bar, 1 μm.
(C–F) Correlation plots of the area of FLAG-Usp9X versus HA-AnkG nanodomains (C) and the area of FLAG-Usp9X (D) or HA-AnkG (E) nanodomains versus the area of PLA nanodomains and spine head area versus the area of PLA nanodomains (F) from the HA-AnkG + FLAG-Usp9XWt + TGF-β(−) group or the HA-AnkG + FLAG-Usp9XWt + TGF-β(+) group. Two-tailed non-parametric Spearman correlation was performed, and the 90% confidence interval (CI) was considered for equivalence tests. TGF-β (−): vehicle; TGF-β (+): 20 ng/mL TGF-β for 1 h.

