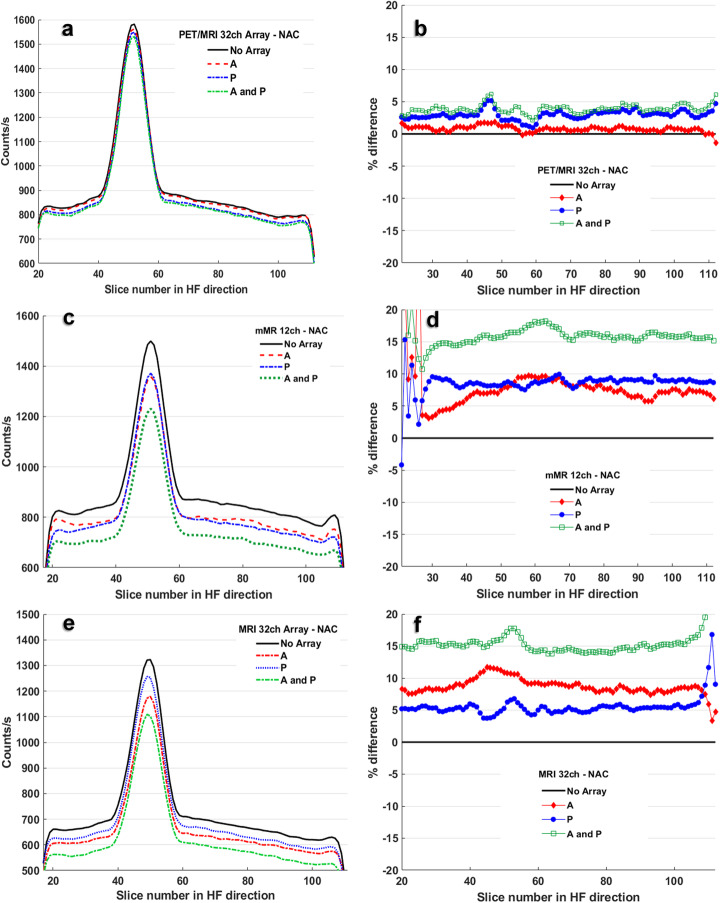
Fig. 2.
NAC data are shown in the left column of the figure, with plots showing as counts per second vs the acquisition plane number for all cases A, P, A&P and no-array. Plots are for (a) the novel PET/MRI 32ch, (c) the mMR 12ch and (e) the MRI 32ch arrays. The right column includes the corresponding RPD plots for each array (b, d and f) at case A, P and A&P, which resulted from estimation of difference between a mean of an image for each case and mean of its matching image from no-array

