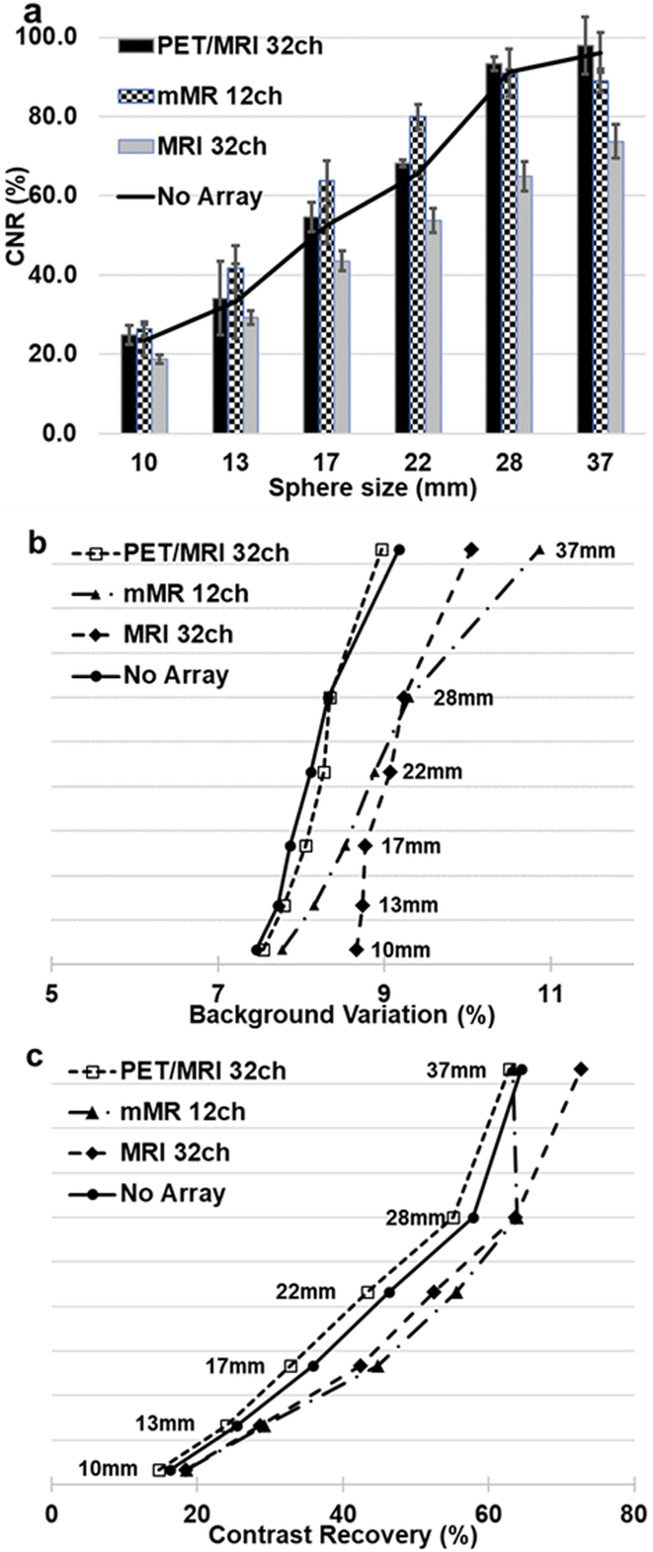
Fig. 5.

DCTAC data for each anterior component of the three arrays are compared to no-array for all spheres, (a) CNR, (b) BV and (c) percentage CR. The CNR measured when using the PET/MRI 32ch anterior was within 2% of the CNR values from no-array for all sphere sizes, while CNR from the MRI 32ch were the lowest for all spheres and values for mMR 12ch similar to the PET/MRI 32ch. Similar patterns were observed for both the CR and BV
