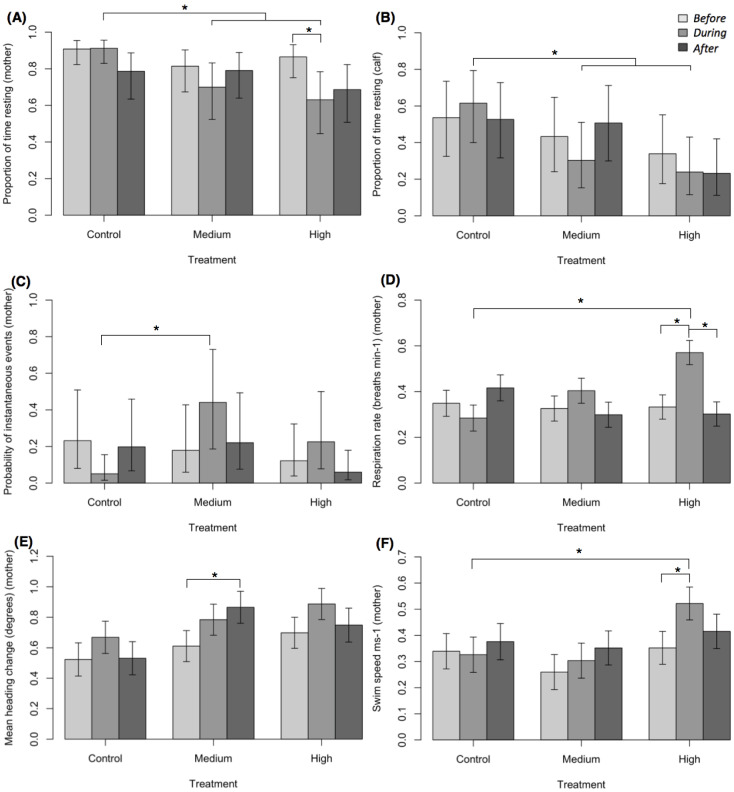
Figure 4. Short-term behavioural responses of humpback whales.
(A) Proportion of time resting for the mother, (B) proportion of time resting for the calf, (C) probability of instantaneous behavioural events for the mother, (D) respiration rate for the mother, (E) mean heading change for the mother, and (F) mean swim speed for the mother. Representation of the model (back-transformed from the logit scale A, B, C). Vertical lines represent standard errors. Asterisks indicate significant differences among phases and/or treatments.
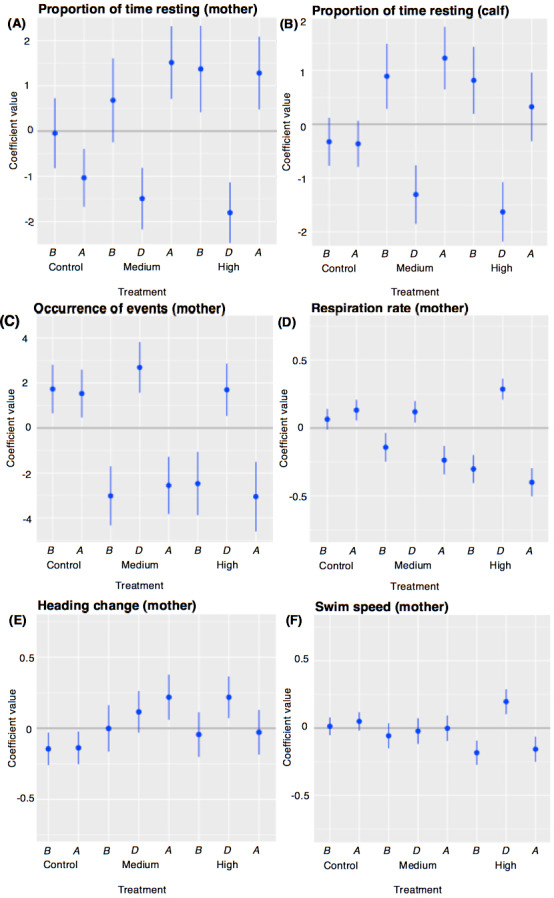
Figure 4—figure supplement 1. Coefficient plots of model outputs.


