. 2020 Jun 8;9:e54507. doi: 10.7554/eLife.54507

Figure 2. Validation error for Locator runs on simulations with varying dispersal rates.

Simulations were on a 50 × 50 landscape and error is expressed in map units. (A) True and predicted locations by population mean dispersal rate and number of SNPs. 450 randomly-sampled individuals were used for training. (B) Error for runs with 100,000 SNPs and varying numbers of training samples. (C) Error for runs with 450 training samples and varying number of SNPs. Plots with error in terms of generations of expected dispersal are shown in Figure 2—figure supplement 1.

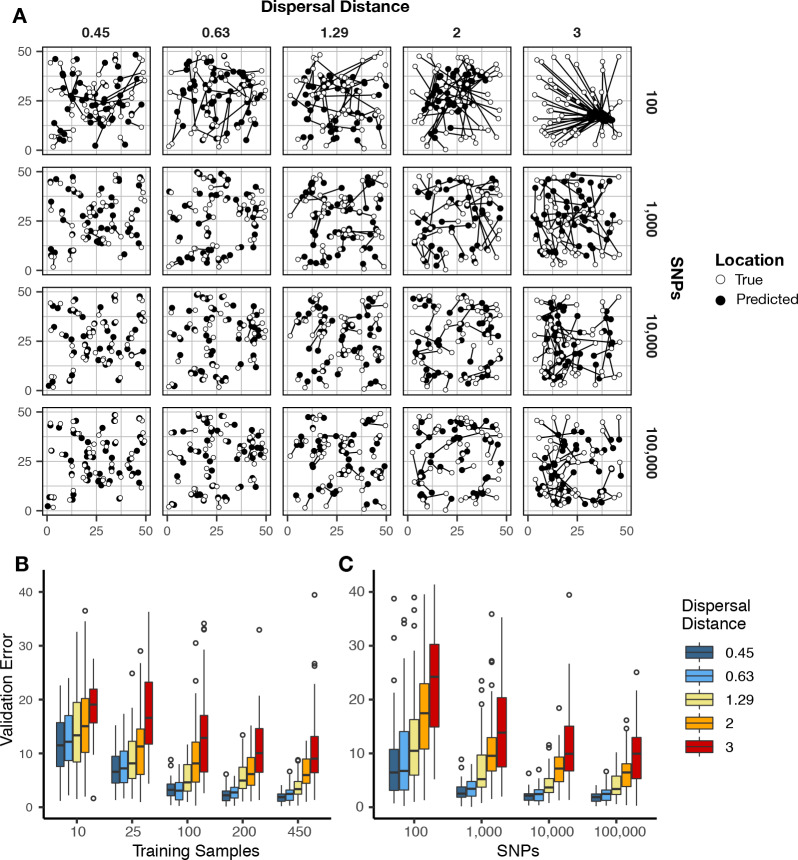
Figure 2.

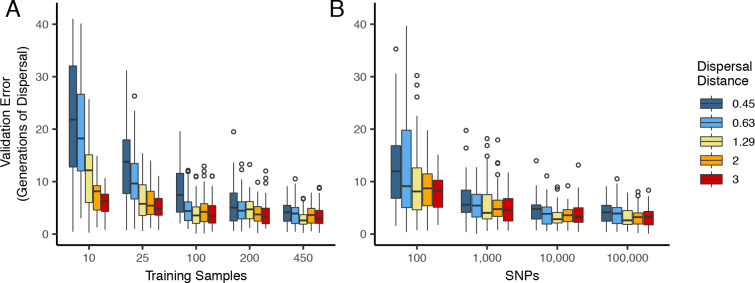
Figure 2—figure supplement 1. Validation error for Locator runs on simulations with varying dispersal distance, expressed in generations of mean dispersal (test error divided by mean dispersal distance per generation).

Figure 2—figure supplement 1.

(A) Error for runs with 100,000 SNPs and varying numbers of training samples. (B) Error for runs with 450 training samples and varying number of SNPs.
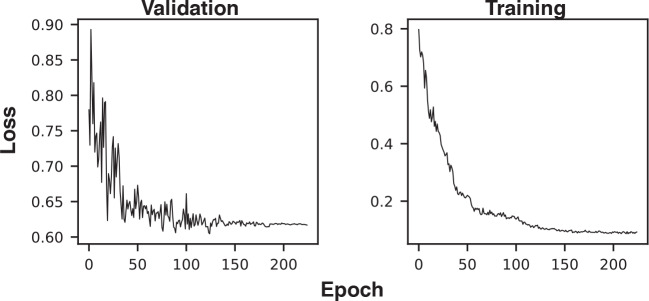
Figure 2—figure supplement 2. Example training and validation loss histories.

Figure 2—figure supplement 2.

The first three epochs (with very high loss) were excluded from the plot to improve axis scaling.