. 2020 Jun 8;9:e54507. doi: 10.7554/eLife.54507

Figure 5. Top – Predicted locations for 153 Anopheles gambiae/coluzzii genomes from the AG1000G panel, using 612 training samples and a 2Mbp window size.

The geographic centroid of per-window predictions for each individual is shown in black points, and lines connect predicted to true locations. Sample localities are colored by the mean test error with size scaled to the number of training samples. Bottom – Uncertainty from predictions in 2Mbp windows. Contours show the 95%, 50%, and 10% quantiles of a two-dimensional kernel density across windows.

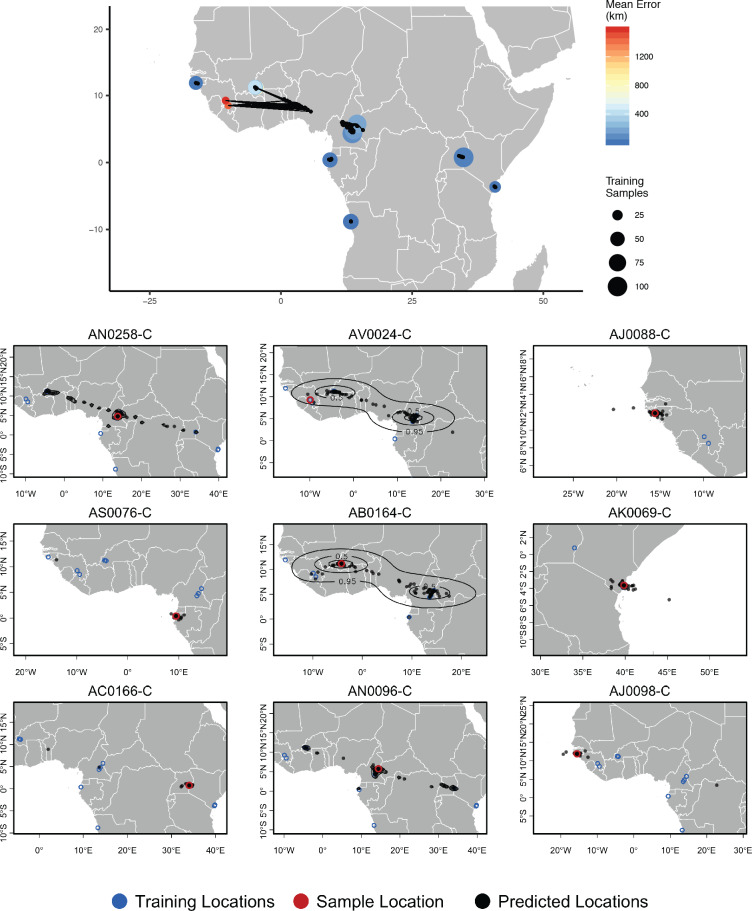
Figure 5.

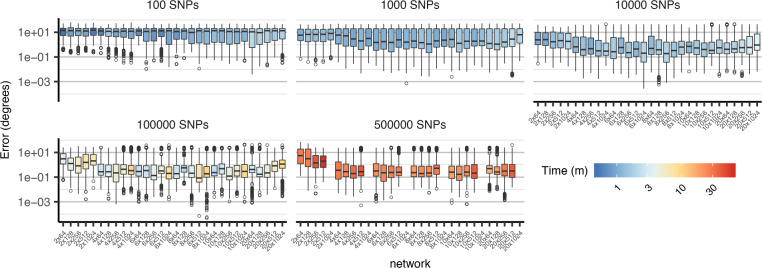
Figure 5—figure supplement 1. Comparison of cross-validation performance on the ag1000g dataset using SNPs from chromosome 3R, under varying network architectures and numbers of SNPs.

Figure 5—figure supplement 1.

Boxplots show the distribution of Euclidean distance between the true and predicted locations of validation samples across 10 replicate training runs. Network shapes are described on the horizontal axis as 'layers × width’. Although two-layer networks are typically the least accurate, no single architecture provides consistently better performance across datasets of different sizes. Missing networks required over 12 GB GPU RAM.
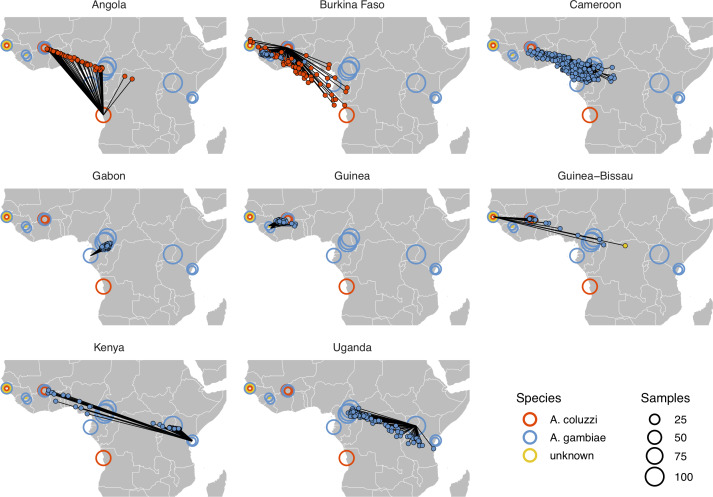
Figure 5—figure supplement 2. Performance on 10,000 SNPs from chromosome 2L in the ag1000g phase one dataset when all samples from localities in the true country are dropped from the training set.

Figure 5—figure supplement 2.

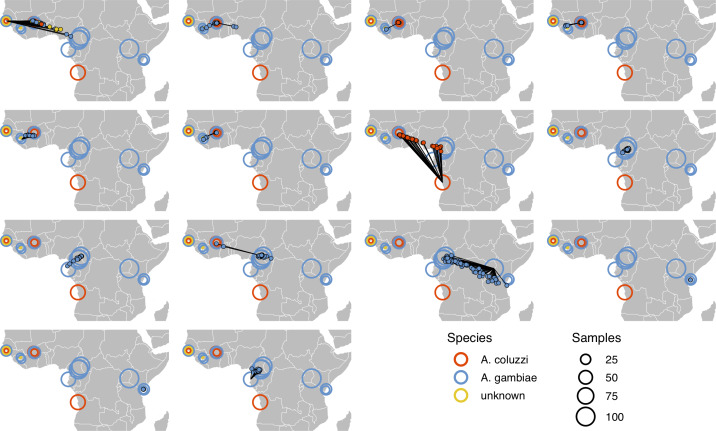
Figure 5—figure supplement 3. Performance on 10,000 SNPs from chromosome 2L in the ag1000g phase one dataset when all samples from the true locality are dropped from the training set.

Figure 5—figure supplement 3.