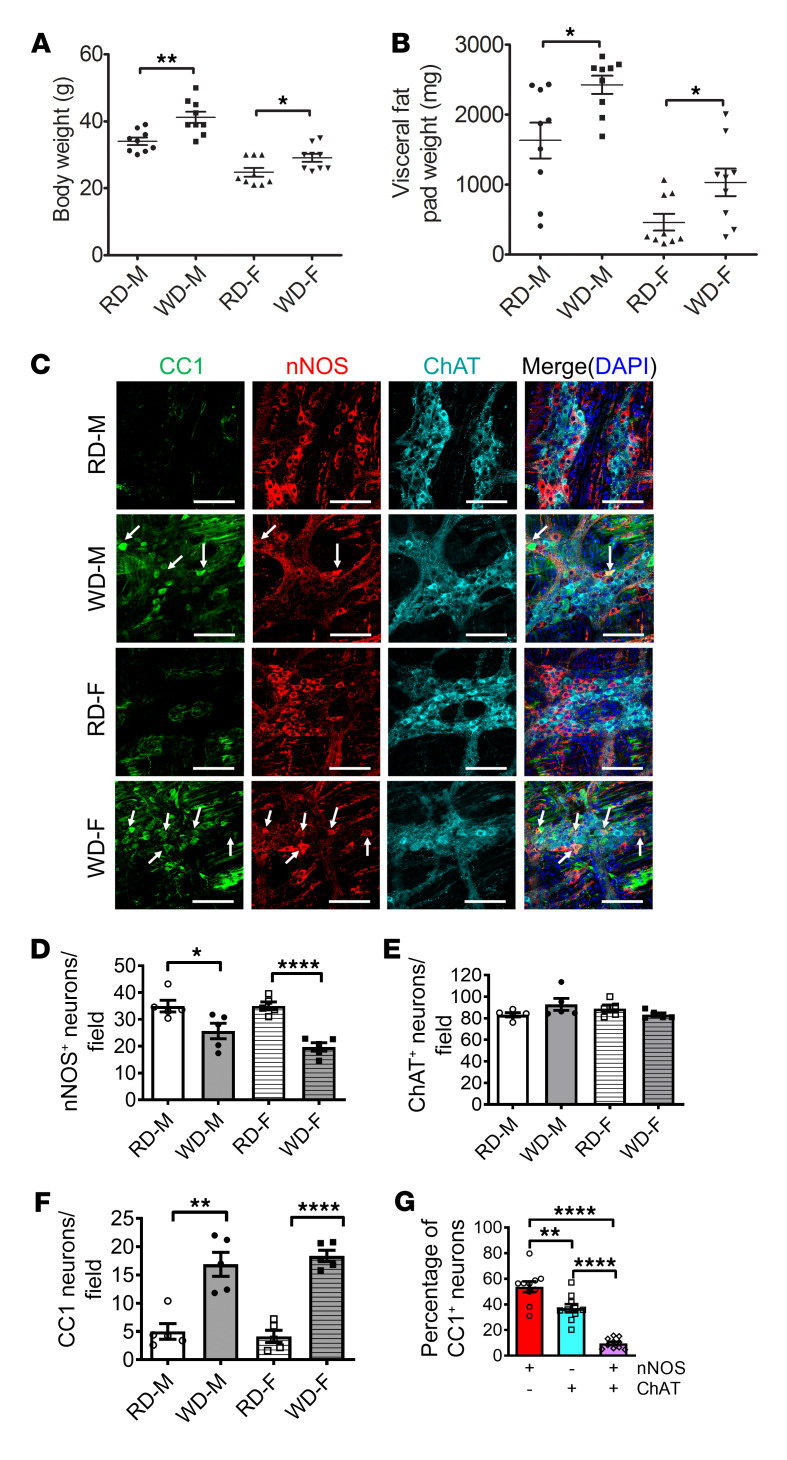
Figure 2. WD increases body weight and induces pyroptosis in nitrergic, but not cholinergic, enteric neurons in mice.
Six-week-old CF-1 mice were fed with an RD or WD for 12 weeks. (A) Body weight (g) and (B) visceral fat pad weight (mg) of RD- and WD-fed male (M) and female (F) mice. n = 9 per group. (C) Representative images of CC1, nNOS, and ChAT staining of proximal colon. Arrows indicate the colocalization of CC1 and nNOS. Scale bars: 100 μm. The number of (D) nNOS+ neurons, (E) ChAT+ neurons, and (F) CC1+ neurons per field in proximal colon from RD- and WD-fed male and female mice, and (G) the percentage of nNOS+, ChAT+, and both nNOS+ and ChAT+ neurons that are CC1+ in proximal colon from WD-fed male and female mice. n = 5 per group. Data presented as the mean ± SEM. *P < 0.05; **P < 0.01; ****P < 0.0001 by 1-way ANOVA with Dunnett’s multiple-comparisons test and Bartlett’s test of equal variances.

