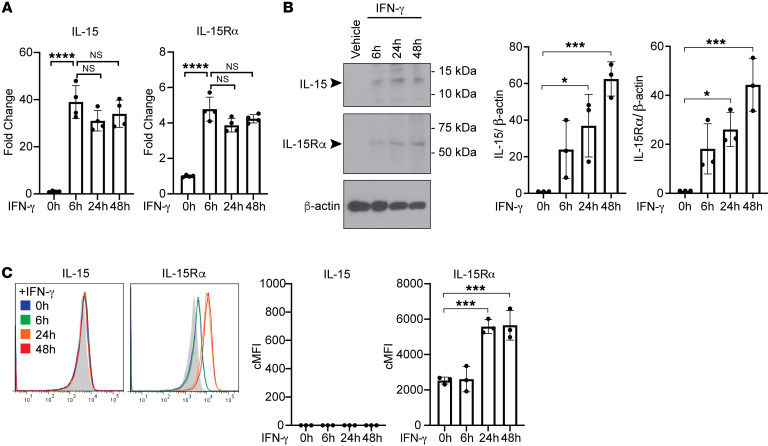
Figure 1. IFN-γ induces human ECs to upregulate expression of intracellular IL-15 and IL-15Rα and surface IL-15Rα.
(A) ECs were treated with IFN-γ for 6 hours, 24 hours, and 48 hours. IL-15 and IL-15Rα transcript levels were assessed by qRT-PCR (n = 4). (B) After IFN-γ treatment for 6 hours, 24 hours, and 48 hours, EC cell lysates were analyzed for IL-15 and IL-15Rα by immunoblotting. Densitometric values of IL-15 and IL-15Rα bands on exposed immunoblots from 3 independent experiments using 3 HUVEC donors were calculated and normalized to the intensity of β-actin bands (n = 3). (C) ECs were treated with IFN-γ for 6 hours, 24 hours, and 48 hours and analyzed for surface IL-15 and IL-15Rα staining by flow cytometry. FACS plots show a representative experiment (n = 3). Data represent mean SEM. *P < 0.05; ***P < 0.001; ****P < 0.0001; 1-way ANOVA and Tukey’s multiple comparisons test. Representative of 3 independent experiments using 3 HUVEC donors.

