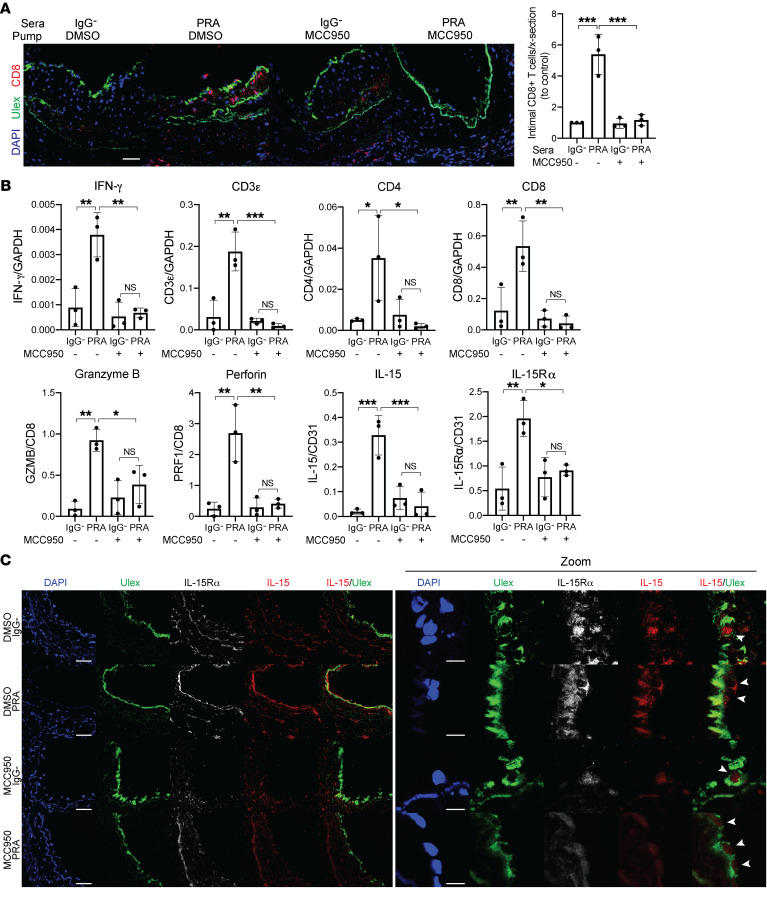
Figure 6. MCC950 blocks MAC-induced IL-15/IL-15Rα transpresentation by human ECs lining human artery xenografts and reduces the enhanced allogeneic memory CD8+ T cell infiltration, proliferation, and differentiation in vivo.
(A) Artery grafts from Figure 6 were stained for Ulex to detect human endothelium and CD8. Infiltrating intimal CD8+ T cells were identified and quantified following immunofluorescence staining (n = 3). Scale bar: 50 μm. (B) qRT-PCR analysis of IL-15 and IL-15Rα (normalized to CD31); CD3ε, CD4, and CD8 (normalized to GAPDH); and granzyme B and perforin (normalized to CD8) in the grafts (n = 3). (C) Human ECs lining grafts were analyzed for IL-15 and IL-15Rα staining by immunofluorescence. Scale bar: 50 μm. Zoom shows higher magnification of the IL-15 and IL-15Rα staining of the human ECs lining the grafts, indicated by arrowheads, shown in the left panel. Scale bars: 10 μm. Note that IL-15 staining is increased in PRA-treated grafts, a change that is abrogated by MCC950, and that upon enlargement of the images, IL-15 staining is no longer confined to the nucleus of the ECs. Data represent mean ± SEM. *P < 0.05; **P < 0.01; ***P < 0.001; 1-way ANOVA and Tukey’s multiple comparisons test. Results shown are representative of 3 artery grafts from 3 different artery donors.

