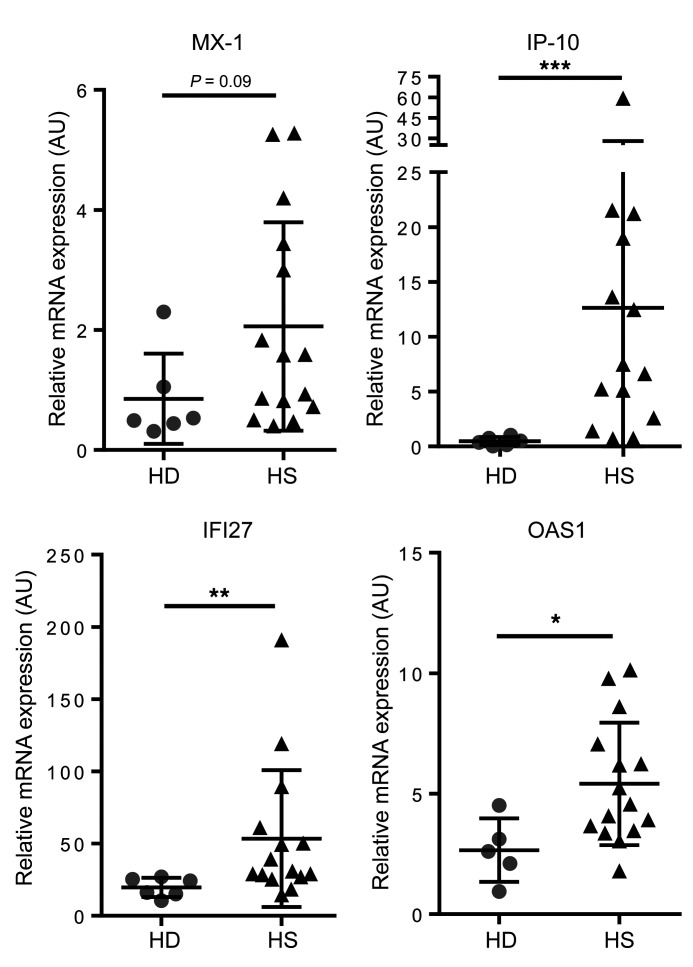
Figure 2. IFN signature in hair follicle cells isolated from HS patients.
Relative mRNA levels of MX-1, IP-10, IFI27, and OAS1 in freshly isolated total hair follicle cells from HS patients (n = 14 or 15) and HD controls (n = 5 or 6). Horizontal lines represent the mean ± SD. *P < 0.05; **P < 0.01; ***P < 0.001 by Mann-Whitney U test.

