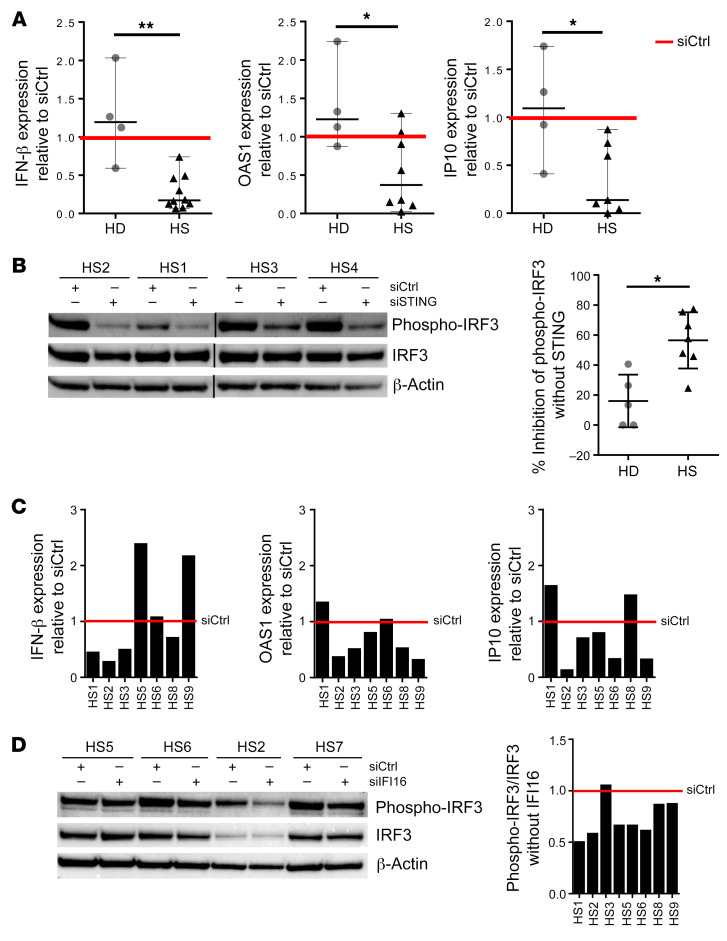
Figure 8. The IFI16/STING pathway induces type I IFN production in HS-ORSCs.
(A) mRNA levels of IFN-β, IP-10, and OAS1 in ORSCs transfected with siSTING. HS-ORSCs (n = 7) or HD-ORSCs (n = 4) were transfected with siRNA-STING for 2 days before mRNA quantification and Western blot analysis were performed. Red line shows siCtrl level expression for each gene. (B) Western blot analysis of the levels of phospho-IRF3 in ORSCs transfected with siSTING or siCtrl. Quantification of phospho-IRF3 signal intensity in HS-ORSCs (n = 7) and HD group (n = 5). (C) Levels of IFN-β, IP-10, and OAS1 mRNA in ORSCs transfected with siRNA-IFI16. HS-ORSCs (n = 7) were transfected with siRNA-IFI16 for 2 days before mRNA quantification and Western blot analysis were performed. (D) Western blot analysis of the levels of phospho-IRF3 in ORSCs transfected with siIFI16 or siCtrl. Quantification of phospho-IRF3 signal intensity in HS-ORSCs (n = 7). *P < 0.05; **P < 0.01 by Mann-Whitney U test.

