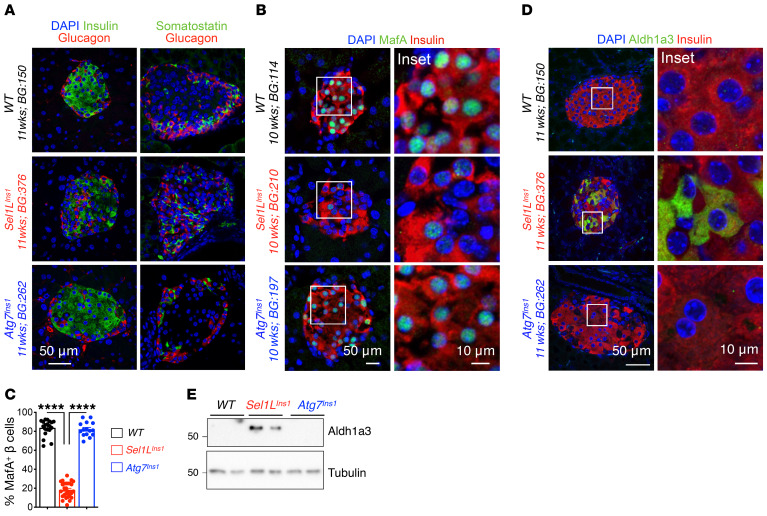
Figure 5. Sel1L deficiency leads to downregulation of maturation markers and upregulation of immature markers in adult β cells.
(A) Representative immunofluorescence image showing major islet hormones (insulin, glucagon, and somatostatin; DAPI in blue) in pancreatic sections of WT, Sel1LIns1, and Atg7Ins1 mice (n = 3 mice each). (B–D) Representative immunofluorescence image showing staining of (B) maturation marker MafA with quantitation in C (n = 3 mice, each dot represents an islet), and (D) dedifferentiation marker Aldh1a3 in indicated genotypes. (E) Western blot analysis of Aldh1a3 in primary islets. Values are shown as mean ± SEM. ****P < 0.0001, 1-way ANOVA.

