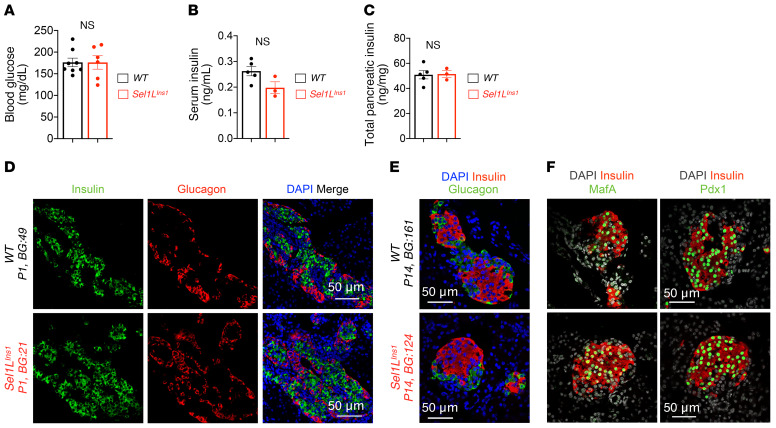
Figure 6. Sel1L deficiency does not affect β cell development.
(A) Blood glucose, (B) serum insulin, and (C) total pancreatic insulin content in P14 pups. (D and E) Representative immunofluorescence images of insulin and glucagon at P1 (D) and P14 (E) (DAPI in blue, n = 3 mice for each genotype). (F) Representative immunofluorescence images of β cell transcription factors MafA and Pdx1 in P14 pups (DAPI in gray, n = 3 mice for each genotype). Values are shown as mean ± SEM. NS, not significant by unpaired Student’s t test.

