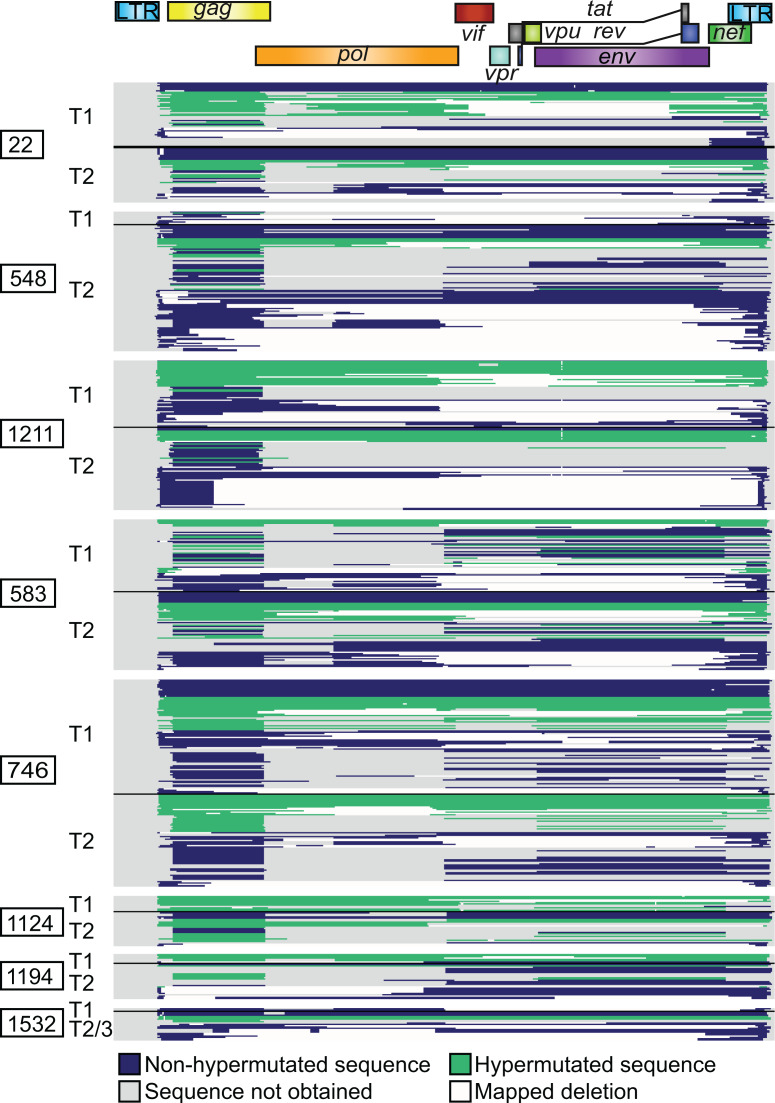
Figure 1. Landscape of HIV-1 provirus genomes at 2 widely spaced time points.
Six hundred sixty-one individual provirus genomes were obtained by near-full-length sequencing from peripheral resting CD4+ T cells from 8 participants who maintained suppressed viral loads on ART for years. Each horizontal bar represents a single provirus genome. The inner PCR primers corresponding to Gag and Env were the most likely to amplify, being the shortest. Therefore, nucleotides in the Gag and Env regions are more likely to be sequenced using this method than nucleotides in other regions. Areas that are gray correspond to regions in the provirus for which sequence was not obtained and may or may not contain a deletion. Areas that are white correspond to mapped deletions. T1, T2, and T3: time points 1, 2, and 3.

