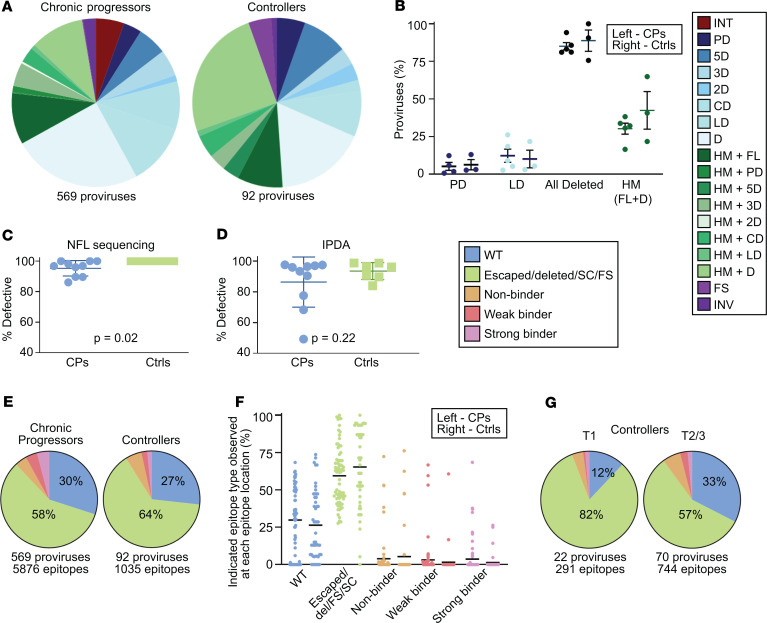
Figure 9. Persistence of defective HIV-1 proviruses in controllers on ART is similar to that of chronic progressors on ART.
(A) Summary of provirus types obtained from all time points of the chronic progressors (left) and controllers (right) maintained on long-term suppressive ART. (B) Percentage of various types of defective proviruses relative to total sampled proviruses from 5 chronic progressors (left) and 3 controllers (right), with mean and SEM shown in black. Only 4 categories are shown because only these types are present in all 3 controllers. (C and D) Plots of the percentage of defective proviruses at each participant time point for chronic progressors (left) and controllers (right) on ART by near-full-length sequencing (C) and by IPDA (D). Two-tailed t test P values shown. (E) Summary pie charts of Gag, Pol, and Nef epitope sequences from predicted dominant epitopes from proviruses isolated from chronic progressors and controllers. (F) Percentage of indicated epitope type relative to total epitope sequences at each of 75 (CP, left) or 50 (Ctrl, right) predicted dominant epitopes from 5 CPs and 3 Ctrls, with the mean shown in black. (B and F) No significant differences were observed when the nonparametric Kruskal-Wallis test was applied. (G) Summary pie charts of Gag, Pol, and Nef epitope sequences from Ctrls at time point 1 (T1) and T2/3. E–G share a figure legend. CPs, chronic progressors; Ctrls, controllers; INT, intact; PD, deletion in packaging signal or major splice donor site; LD, deletion of more than 75% of HIV-1 genome length; HM, hypermutated; FL, full-length; FS, intact provirus save for 1 frameshift (A) or preceding frameshift mutation (E–G); INV, deleted with inverted sequence; Del, deleted; SC, preceding stop codon; NFL, near full-length; IPDA, intact proviral DNA assay.

