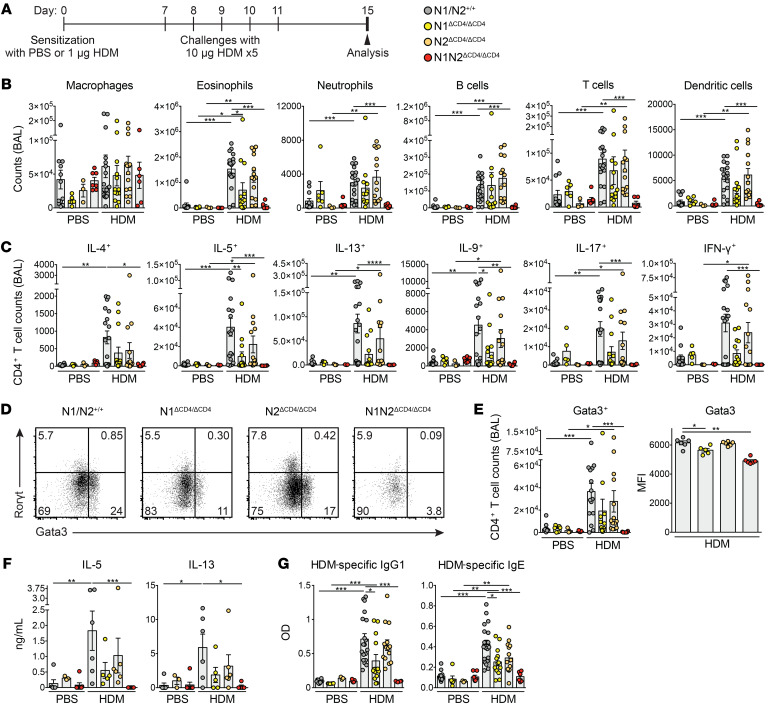
Figure 1. Notch1/2 expression on CD4+ T cells is required for AAI induction.
(A) Acute HDM-driven AAI induction protocol. (B) Numbers of FSChiSSChi+CD11c+Siglec-F+ autofluorescent macrophages, FSCintSSChiSiglec-F+ eosinophils, Ly-6G+ neutrophils, CD19+ B cells, CD3+CD4+ T cells, and CD11c+MHCIIhi DCs in BAL fluid of PBS- or HDM-sensitized mice. (C) Intracellular flow cytometry quantification of the numbers of CD3+CD4+ T cells in BAL fluid expressing the indicated cytokines. (D and E) Flow cytometric RORγt/Gata3 profile in CD3+CD4+ T cells in BAL from HDM-treated mice (D) and quantification of Gata3+ cell numbers (left) and Gata3 mean fluorescence intensity (MFI) in Gata3+ T cells (right) (E). (F) Cytokine production in vitro by HDM-restimulated MedLN cells, measured by ELISA. (G) HDM-specific IgG1 and IgE levels in serum, determined by ELISA. Data are shown as individual values from 3–16 mice per group, together with the mean ± SEM, and are combined from 2 independent experiments. *P < 0.05; **P < 0.01; ***P < 0.001 by Kruskal-Wallis test.

