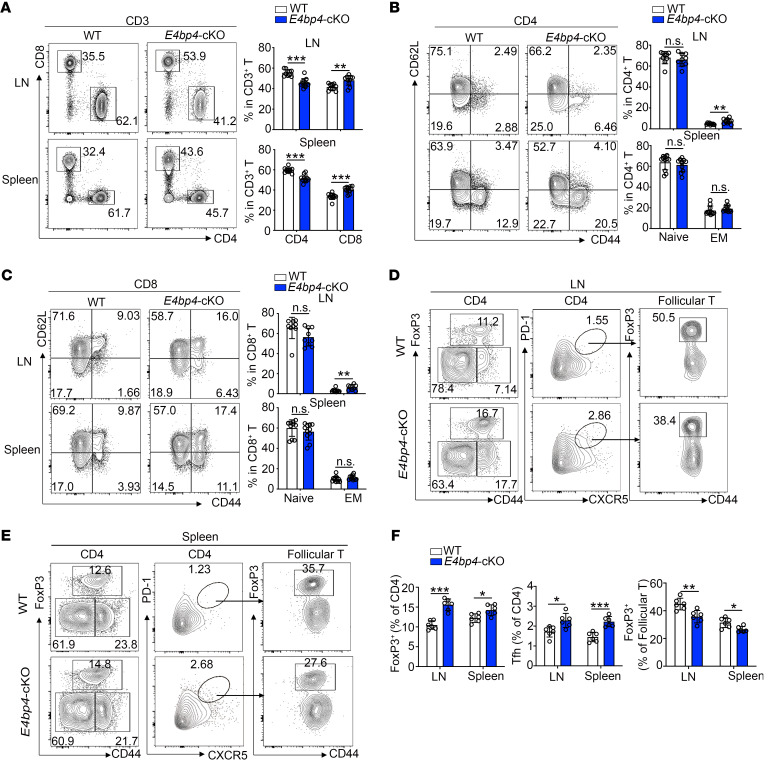
Figure 2. Phenotypical analysis of the E4bp4-cKO mice.
(A) Flow cytometric analysis of the CD4+ and CD8+ T cell populations in CD3+ T cells of nonimmunized WT and E4bp4-cKO mice. Statistical analysis is shown on the right. (B and C) Flow cytometric analysis of CD44+ and CD62L+ cells in CD4+ and CD8+ T cell populations (n = 10). (D and E) Flow cytometric analysis of Treg, Tfh, and Tfr cells. (F) Statistical analysis of D and E (n = 6). Data are representative of 4 independent experiments. LN, lymph node; EM, effector memory. Student’s t test. *P < 0.05; **P < 0.01; ***P < 0.001.

