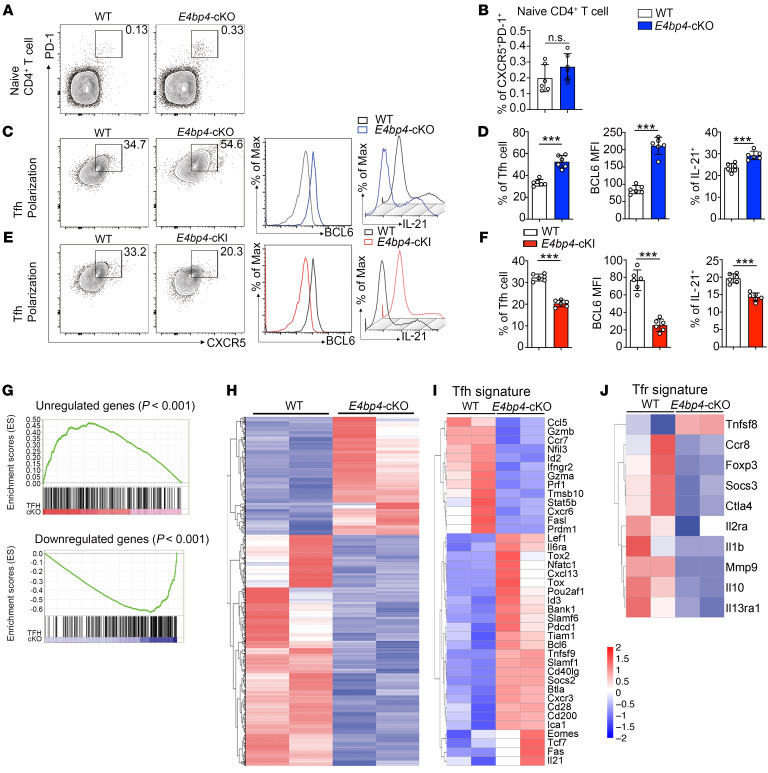
Figure 3. E4BP4 regulates Tfh cell differentiation in vitro.
(A) Flow cytometric analysis of CXCR5+PD-1+ in naive CD4+ T cells from the E4bp4-cKO and WT mice. Statistical analysis is indicated in B. (C–F) Flow cytometric analysis of in vitro–polarized Tfh-like cells from the E4bp4-cKO and WT mice and from the E4bp4-cKI and WT mice. Representative histograms of BCL6 and IL-21 expression in CD4+CXCR5+PD-1+ Tfh-like cells are shown in D and F (n = 6). (G) Gene set enrichment analysis of gene signatures (either upregulation or downregulation) in Tfh cells relative to their expression in non–Tfh cells from published data (GEO accession code GSE16697), and differentially expressed genes between the in vitro–polarized E4bp4-cKO Tfh-like cells and WT Tfh-like cells. Red/blue rectangles indicate enriched genes in the E4bp4-cKO Tfh-like cells. (H) RNA-seq analysis of gene expression of in vitro–polarized Tfh-like cells; colors indicate upregulated (red) or downregulated (blue) genes. (I) Clustered heatmap of 39 Tfh signature genes regulated by E4BP4. (J) Clustered heatmap of 10 Tfr signature genes regulated by E4BP4. The data were normalized from 2 replicates (n = 2). Genes with the most transcriptional changes are listed. (A–F) Data are representative of 3 independent experiments. Student’s t test. *P < 0.05; **P < 0.01; ***P < 0.001.

