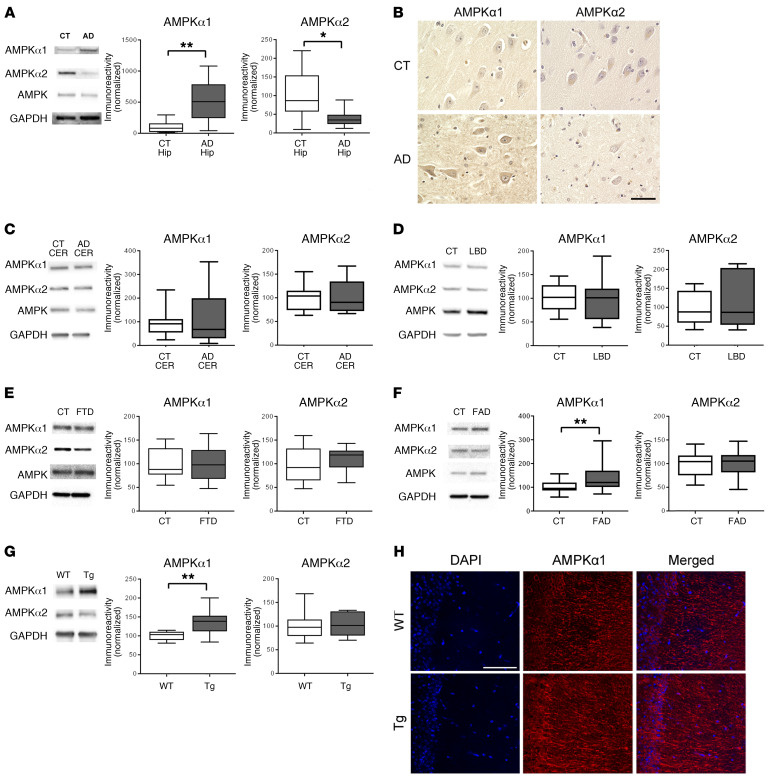
Figure 1. Expression of AMPKα isoforms is dysregulated in AD hippocampus.
(A) Hippocampus (Hip) lysate from sAD patients showed increased AMPKα1 and decreased AMPKα2 levels as compared with those of age-matched controls (CT). n = 10 with up to 4 technical replicates. *P = 0.0119; **P = 0.0014, unpaired t test. (B) Representative images of AMPKα isoform dysregulation in area CA1 of hippocampus in AD and age-matched control patients. Scale bar: 50 μm. Immunohistochemical experiments were replicated independently 3 times. (C) AMPKα isoform expression was unaffected in cerebellum (CER) samples from AD patients. n = 5 with up to 3 technical replicates. P = 0.8457 for AMPKα1; P = 0.9870 for AMPKα2, unpaired t test. (D) Hippocampal lysate from LBD patients had unaffected AMPKα isoform levels. n = 4 for control; n = 3 for LBD with 1 technical replicate. P = 0.9146 for AMPKα1; P = 0.5635 for AMPKα2, unpaired t test. (E) Levels of AMPK isoforms were unaltered in hippocampal tissue from FTD patients. n = 8 for control with 1 technical replicate; n = 5 for FTD with up to 3 technical replicates. P = 0.9283 for AMPKα1; P = 0.335 for AMPKα2, unpaired t test. (F) AMPKα1 levels were significantly increased in cortical lysates from FAD patients, while AMPKα2 levels were unaffected. n = 5 with 4 technical replicates. **P = 0.0060 for AMPKα1; P = 0.9412 for AMPKα2, unpaired t test. (G) AMPKα1 levels were significantly increased in hippocampal lysates from Tg19959 AD model mice compared with WT controls. AMPKα2 levels were unaffected. n = 7 with up to 2 technical replicates. **P = 0.0023 for AMPKα1; P = 0.9094 for AMPKα2, unpaired t test. Box-and-whisker plots represent the interquartile range, with the line across the box indicating the median. Whiskers show the highest and lowest values detected. (H) Immunofluorescent labeling of DAPI (blue) and AMPKα1 (red) distribution in area CA1 mouse hippocampal slices. n = 3. Scale bar: 200 μm.

