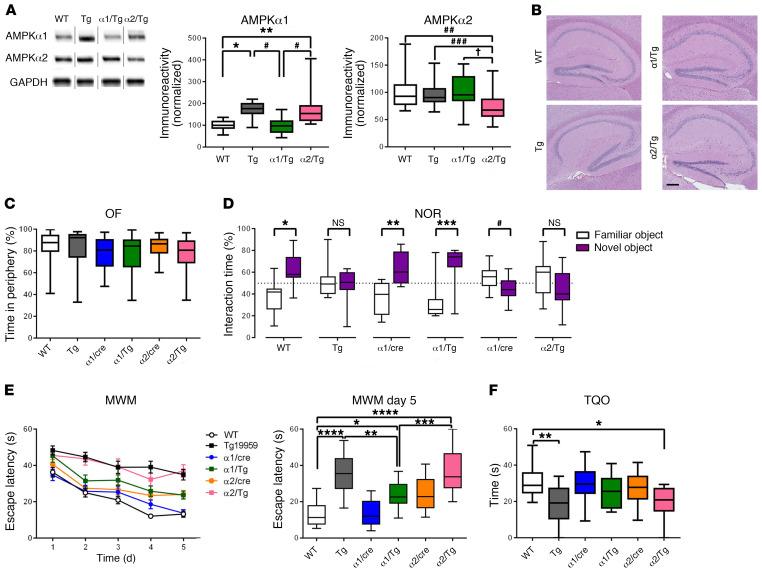
Figure 2. Brain-specific suppression of AMPKα1 alleviates learning and memory defects in Tg19959 AD model mice.
(A) Brain-specific genetic reduction of AMPKα1 and AMPKα2 in Tg19959 AD model mice. Noncongruous WT, Tg19959 (Tg), AMPKα1+/–/Tg19959 (α1/Tg), AMPKα2+/–/Tg19959 (α2/Tg). n = 10, 10, 6, 7; up to 3 technical replicates. For AMPK α1: WT versus Tg, *P = 0.0212; WT versus α2/Tg, **P = 0.0029; Tg versus α1/Tg, ***P = 0.0130; α1/Tg versus α2/Tg, #P = 0.0016. One-way ANOVA with Tukey’s post hoc test, F = 8.218. For AMPKα2: WT versus α2/Τg, ##P = 0.005; Tg versus α2/Tg, ###P = 0.043; α1/Tg versus α2/Tg, †P = 0.007. One-way ANOVA with Tukey’s post hoc test. F = 7.585. (B) Representative H&E stain of hippocampal structure. n = 3. Scale bar: 50 μm. (C) Percentage of time spent in the periphery for the OF test. n = 25, 21, 17, 14, 19, and 13. (D) Percentage of time spent with familiar (white) and novel (purple) objects in the NOR task during the testing phase. Preference of less than 50% indicates cognitive impairment. n = 19, 13, 10, 9, 10, and 8. Statistical preference for novel or familiar object: WT, *P < 0.0001; Tg, P = 0.5523; α1/cre, **P = 0.0004; α1/Tg, ***P = 0.0008; α2/cre, #P = 0.0465; α2/Tg, P = 0.1497, unpaired t test. (E) Escape latency (s) over 5 days of training in the hidden platform MWM. Four trials/day, 5 days. n = 19, 17, 13, 17, 19, and 13. WT versus α1/Tg, *P = 0.0256; Tg versus α1/Tg, **P = 0.0094; α1/Tg versus α2/Tg, ***P = 0.0009; ****P < 0.0001, 1-way ANOVA with Tukey’s post hoc test. F = 18.16. (F) Percentage of time spent in the target quadrant during probe trial phase of MWM task. WT versus α2/Tg, *P = 0.0186; WT versus Tg, **P = 0.0027, 1-way ANOVA with Tukey’s post hoc test. F = 4.525. Box-and-whisker plots represent the interquartile range, with the line across the box indicating the median. Whiskers show the highest and lowest values detected.

