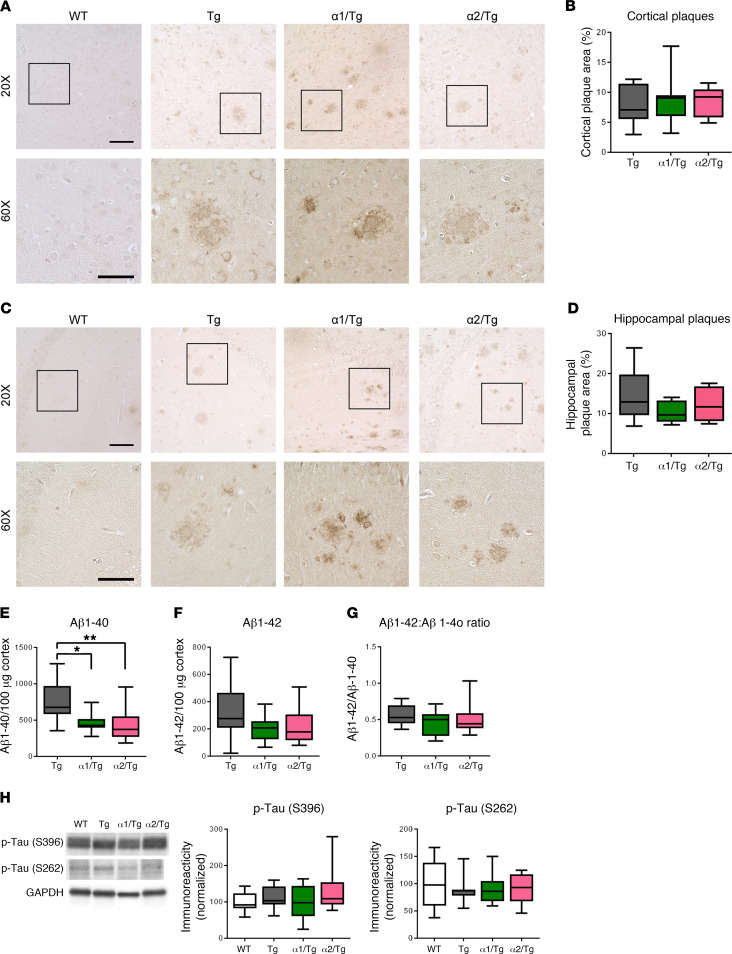
Figure 3. Suppression of AMPKα does not alter AD-associated brain Aβ pathology or tau phosphorylation.
(A) Representative images of cortical Aβ plaque deposition in WT, Tg, α1/Tg, and α2/Tg mice. Scale bars: 100 μm (×20 images); 50 μm (×60 images). (B) Percentage of cortex covered by Aβ plaques in Tg, α1/Tg, and α2/Tg mice. n = 9 slices/3 mice. (C) Representative images of hippocampal Aβ plaque deposition in WT, Tg, α1/Tg, and α2/Tg mice. Scale bars: 100 μm (×20 images); 50 μm (×60 images). (D) Percentage of hippocampal area covered by amyloid plaques in Tg, α1/Tg, and α2/Tg mice. n = 9 slices/3 mice. (E) ELISA of prefrontal cortex lysate showed decreases of Aβ1-40 in both α1/Tg and α2/Tg mice, as compared with Tg mice. Tg versus α1/Tg, *P = 0.0356; Tg versus α2/Tg **P = 0.0226, 1-way ANOVA with Tukey’s post hoc test. F = 5.034. (F) ELISA showed no differences in levels of Aβ1-42 in Tg, α1/Tg, and α2/Tg mice. One-way ANOVA with Tukey’s post hoc test. F = 1.771. (G) The ratio of Aβ42:40 was unaltered in Tg, α1/Tg, and α2/Tg mice. One-way ANOVA with Tukey’s post hoc test. F = 1.635. Tg, n = 12; α1/Tg and α2/Tg, n = 9. (H) Western blot analysis of p-tau (S396 and S262) levels in hippocampus showed no differences among WT, Tg, α1/Tg, and α2/Tg mice. WT, n = 8; Tg, n = 6; α1/Tg, n = 6; α2/Tg, n =7. One-way ANOVA. Box-and-whisker plots represent the interquartile range, with the line across the box indicating the median. Whiskers show the highest and lowest values detected.

