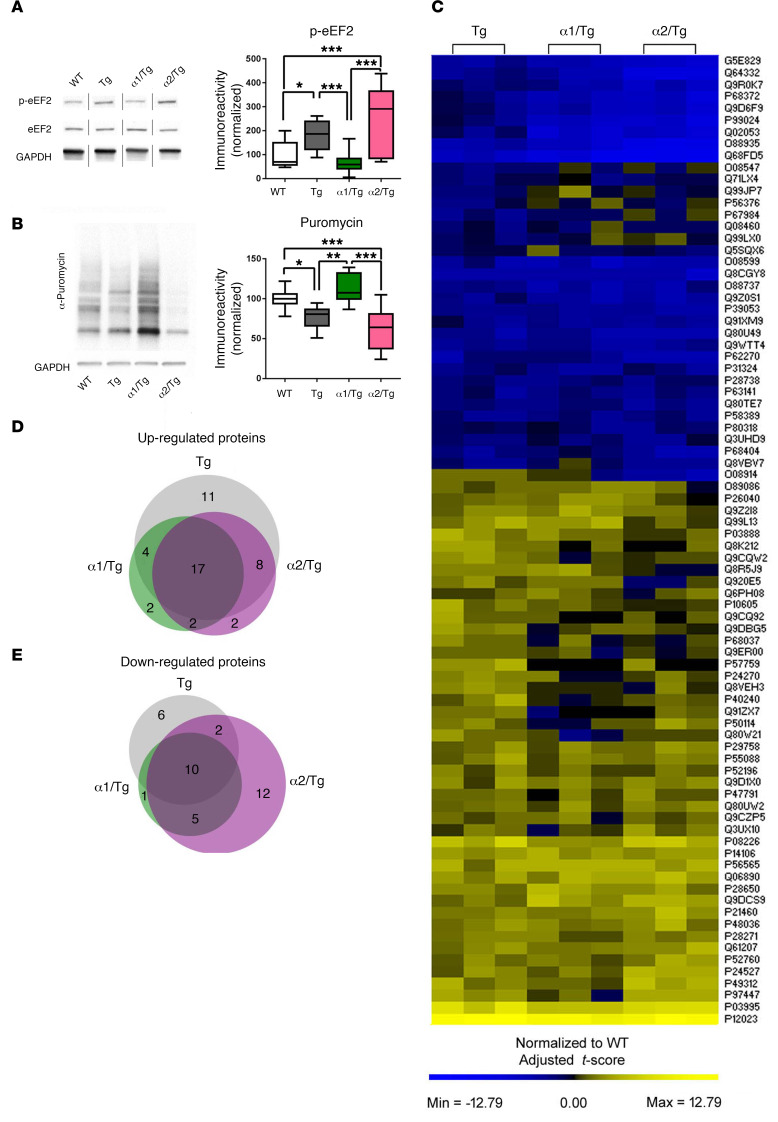
Figure 5. Repression of brain AMPKα1 restores abnormal eEF2 phosphorylation and de novo protein synthesis deficits in Tg19959 mice.
(A) Genetic reduction of AMPKα1, but not AMPKα2, corrected eEF2 hyperphosphorylation in hippocampi of Tg19959 AD model mice. n = 5 with 3 technical replicates, noncongruous. WT versus Tg, *P = 0.0297; ***P < 0.001, 1-way ANOVA with Tukey’s post hoc test. F = 13.88. (B) Representative images and quantification for SUnSET puromycin incorporation assay. Assay was performed on area CA1 of hippocampus. WT, Tg, and α2/Tg, n = 5; α1/Tg, n = 3. *P = 0.0231; **P = 0.0027; ***P < 0.001, 1-way ANOVA with Tukey’s post hoc test, F = 12.85. Box-and-whisker plots represent the interquartile range, with the line across the box indicating the median. Whiskers show the highest and lowest values detected. (C) Patterns of protein expression in hippocampi of WT, Tg, α1/Τg, and α2/Tg mice, reported as normalized deviation from the mean. (D and E) Venn diagrams showing proteins that were significantly altered (upregulated or downregulated) in the Tg conditions that were restored to WT levels in α1/Tg, α2/Tg, or both α1/Tg and α2/Tg hippocampi.

