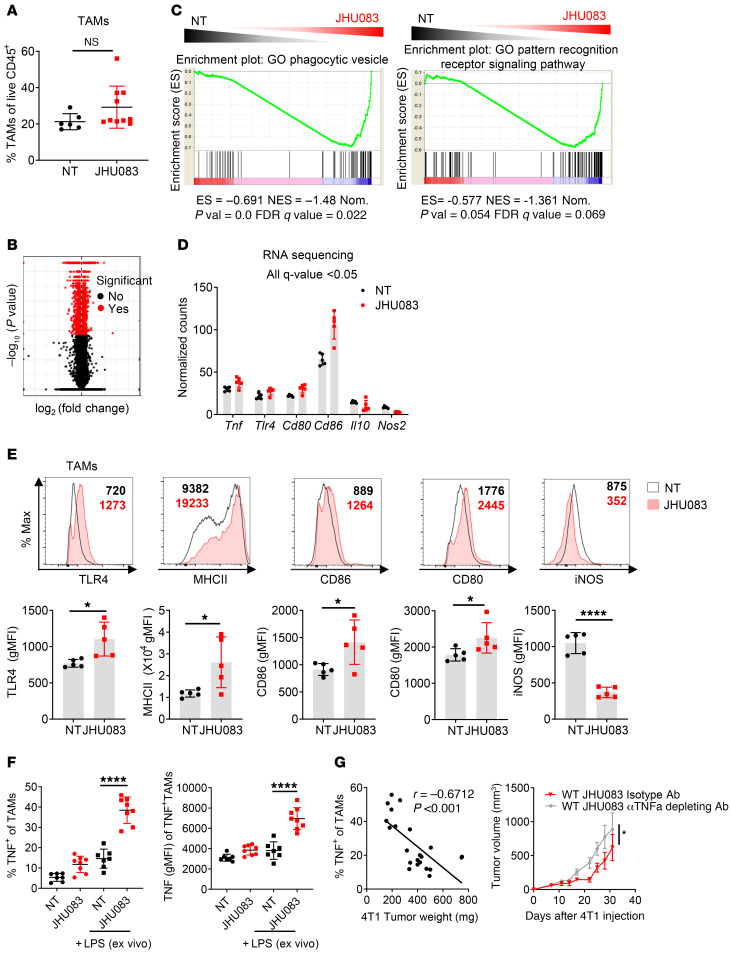
Figure 4. Glutamine antagonism induces reprogramming of TAMs from a suppressive to a proinflammatory phenotype.
(A) Percentages of TAMs from vehicle- or JHU083-treated 4T1 tumor–bearing mice (on day 17). (B) Volcano plot showing significant changes in gene expression (red) from RNA-Seq analysis on NT and JHU083-treated TAMs (CD11b+F4/80+7AAD–Ly6C–Ly6G–CD8–) from 4T1 tumor–bearing mice (on day 14). q < 0.05. (C) Gene set enrichment analysis (GSEA) plot of phagocytic vesicle and pattern recognition receptor signaling activity–related genes in NT versus JHU083 on TAMs. Enrichment scores in the gene set are shown. (D) Normalized gene expression from RNA-Seq analysis of NT (black) and JHU083-treated (red) TAMs from 4T1 tumor–bearing mice (on day 17). All differences in gene expression are significant (q < 0.05). (E) Representative histograms and summary graphs of TLR4, MHCII, CD86, CD80, and iNOS expression on TAMs. (F) Tumor-infiltrating leukocytes were harvested on day 17 from 4T1 tumor–bearing mice treated with or without JHU083. Cells were incubated with GolgiPlug in the presence or absence of LPS for 9 hours ex vivo. Percentages of TNF+ cells were analyzed by flow cytometry (left). Geometric mean fluorescence intensity (gMFI) of TNF from TNF+ cells (right). (G) Correlation of the percentage TNF-secreting TAMs after stimulation with respect to tumor weight (left). 4T1 tumor–bearing mice were treated with JHU083 every day and i.p. injected with isotype antibody or 100 μg anti-TNF antibody (depleting) twice per week starting on day 7 after tumor inoculation (right). Data are from 1 experiment with 5 mice per group (A–D) or from 3 independent experiments with 5 to 10 mice per group (E–G) and are presented as the mean ± SD. NS, not significant. *P < 0.05; ****P < 0.001 by Mann-Whitney test (A), unpaired t test (E), 1-way ANOVA with Tukey’s multiple-comparisons post hoc test (F), Spearman’s correlation (G, left), or 2-way ANOVA with Sidak’s multiple-comparisons test (G, right).

