
Figure 7.
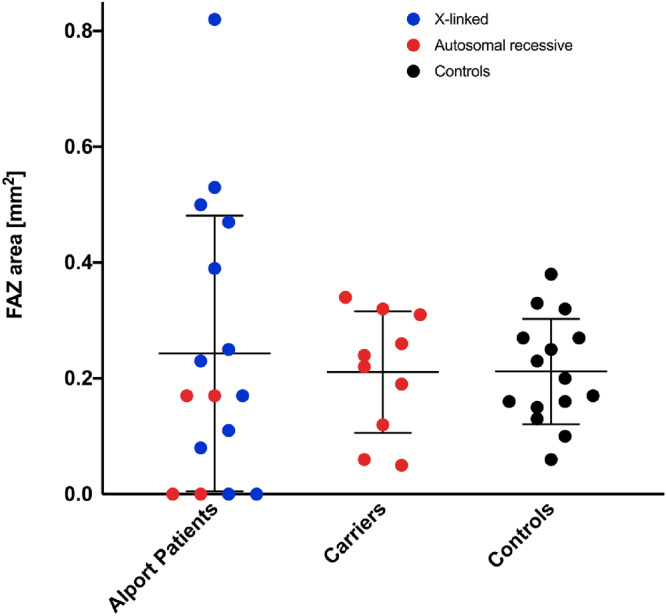
FAZ area in patients, controls and autosomal-recessive carriers. Plot showing the FAZ area size in Alport patients, autosomal-recessive carriers and controls. Blue dots show phenotypes due to an X-linked mutation, and red dots represent autosomal-recessive inheritance. Control subjects are shown as black dots. While absent FAZ is present for X-linked and autosomal recessive phenotypes, enlarged FAZ sizes are only exhibited due to of X-linked mutations. When analyzing the OCTs of the largest FAZ areas in this graph all presented with a staircase foveopathy. Autosomal-recessive carriers show overall similar FAZ areas compared with control subjects.