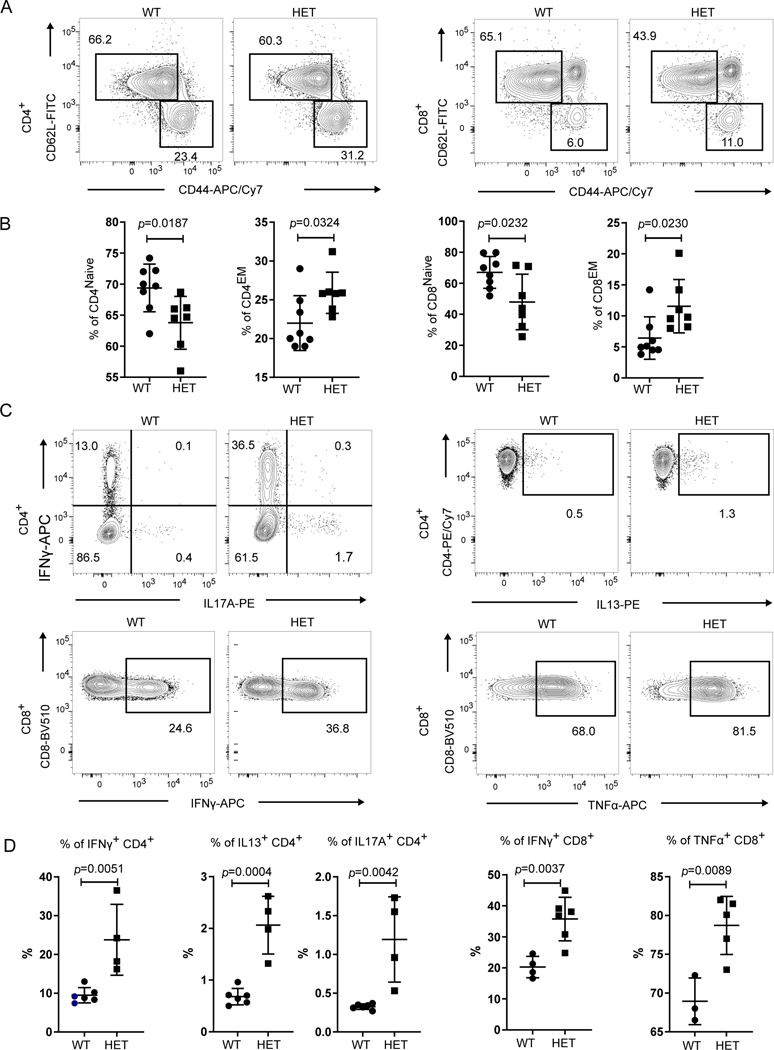
Figure 2. CopaE241K/+ mice have spontaneous activation of cytokine-secreting T cells.
A. Representative flow plots of CD62L versus CD44 expression on splenic CD4+ and CD8+ T cells from Copa+/+ (WT) and CopaE241K/+ (HET) mice.
B. Percentages of naïve and memory CD4+ (left) and CD8+ T (right) cells from indicated mice (3-month-old littermates: WT, n = 8; HET, n = 7).
C. Representative flow plots of intracellular cytokine levels in splenic CD4+ (top: IFNγ, IL17A and IL13) and CD8+ T cells (bottom: IFNγ and TNFα) after PMA/Ionomycin stimulation.
D. left: Percentages of IFNγ, IL17A and IL13 producing CD4+ T cells among total CD4+ T cells from indicated mice (3-month-old littermates: WT, n = 6; HET, n = 4). right: Percentages of IFNγ and TNFα- producing CD8+ T cells among total CD8+ T cells (3-month-old littermates: WT, n = 4; HET, n = 6)
Data are mean ± SD. Unpaired, parametric, two-tailed Student’s t-test was used for statistical analysis. p < 0.05 is considered statistically significant. ns: not significant.

