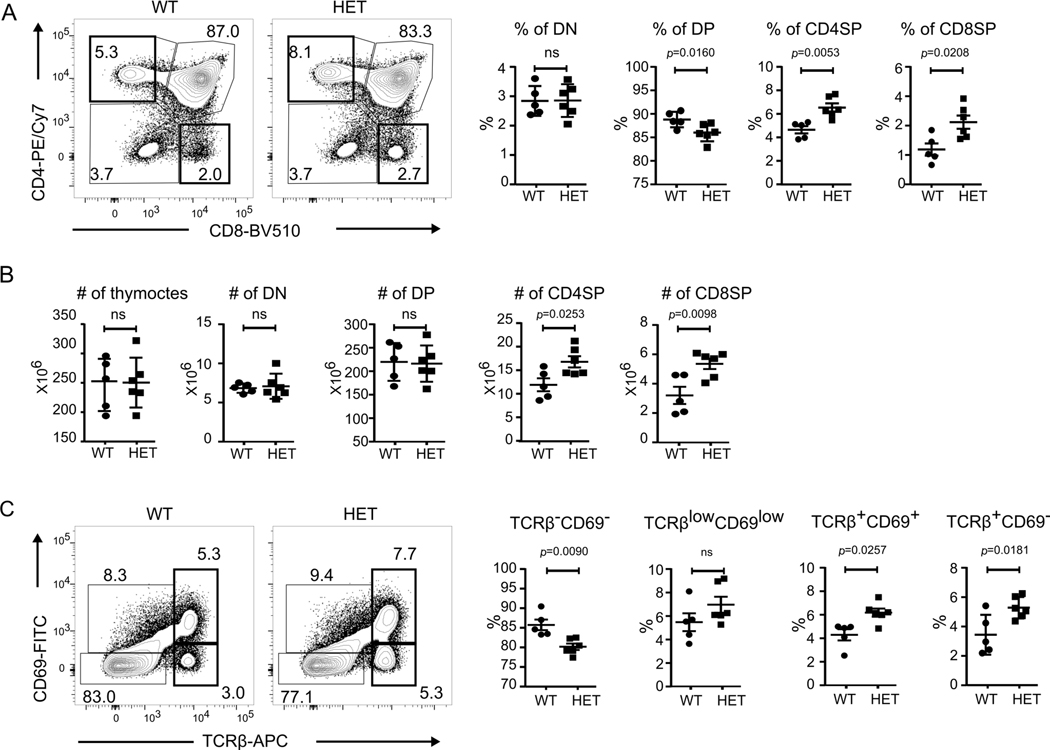
Figure 3. CopaE241K/+ mice have increased single positive thymocytes.
A. left: CD4 and CD8 profile of thymocytes. right: Percentages of double negative (DN), double positive (DP), CD4 single positive (CD4SP) and CD8 single positive (CD8SP) thymocytes from indicated mice (4–6-week-old littermates: WT, n = 5; HET, n = 6).
B. Cell counts of total thymocytes, DN, DP and SP thymocytes in indicated mice (4–6-week-old littermates: WT, n = 5; HET, n = 6).
C. left: CD69 and TCRβ chain on total thymocytes. right: Percentages of TCRβ-CD69-, TCRβlowCD69low, TCRβ+CD69+ and TCRβ+CD69- populations from indicated mice (4–6-week-old littermates: WT, n = 5; HET, n = 6).
Data are mean ± SD. Unpaired, parametric, two-tailed Student’s t-test was used for statistical analysis. p < 0.05 is considered statistically significant. ns: not significant.

