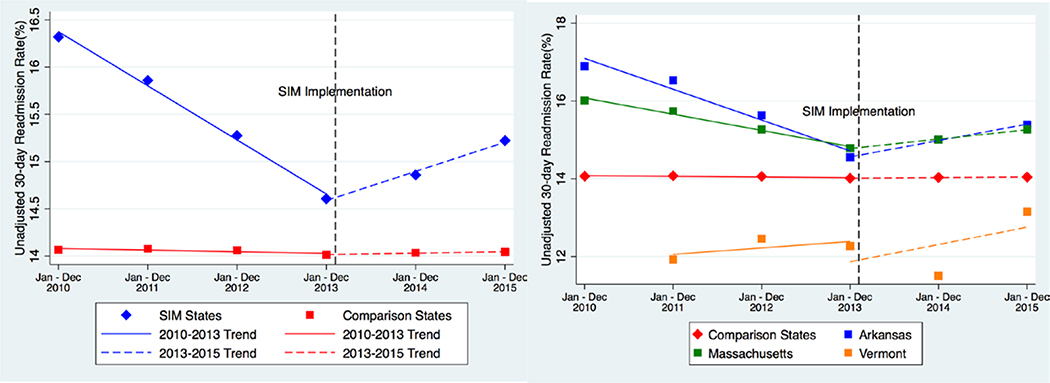
Figure. 30-Day Mean Hospital Readmission Rates among Adults with Diabetes, State Innovation Models Initiative (SIM) States vs. Comparison States.
Note: SIM= State Innovation Models Initiative. The left graph illustrates the three SIM states’ unadjusted 30-day readmission trends grouped together, while the right graph illustrates the three SIM state trends separately. For the right figure, trend lines were estimated by regressing the adjusted, annual, mean readmission rates on the relevant year range using ordinary least squares regression (Model 3). Dataset does not include 2010 data from Vermont because the rehospitalization linkage file was unavailable for the state.
Source: Authors’ analysis of Healthcare Cost and Utilization Project’s State Inpatient Databases

