
Figure 7.
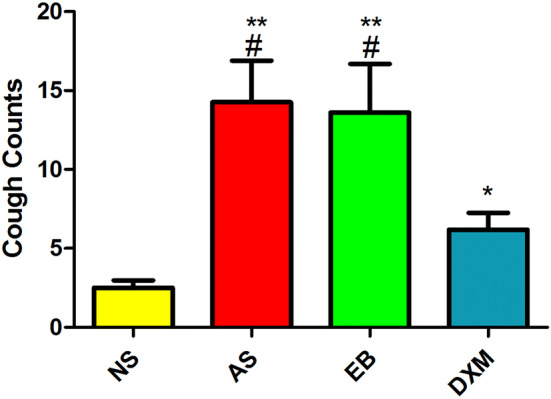
Changes in cough sensitivity in mice for the four groups after model establishment. The frequency of coughs in the asthma and EB groups were significantly higher compared to the NS group (#p < 0.01; ANOVA) and were significantly higher compared to the DXM group (**p < 0.05; ANOVA). The frequency of coughs in the DXM group was significantly higher compared to the NS group (*p < 0.05; ANOVA). Data expressed as mean ± standard deviation (seven animals per group).