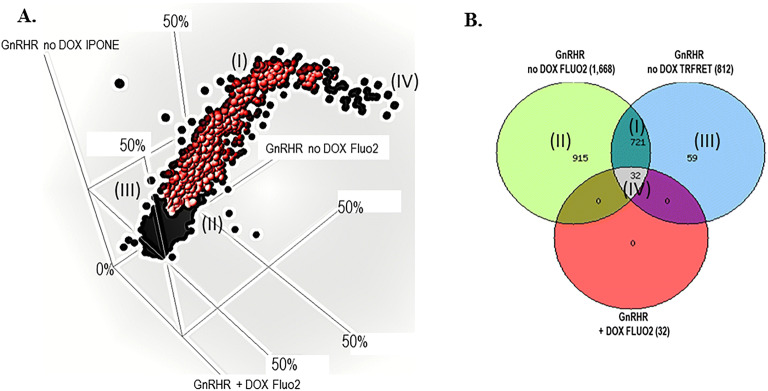
Figure 5.
GnRHR confirmation and counterscreen. (A) The 3-way correlation plot of all compounds tested in all three assay formats represented as average percent response. The red circles represent the 721 selective compounds that are shown in the indicated section of the Venn diagram (I). (B) A Venn diagram representing the active compounds of the three assays. The 721 represents compounds that are active in the GnRHR no DOX Fluo2 assay and GnRHR no DOX IP-One assay and inactive in the GnRHR “+” DOX Fluo2 counterscreen. Each section of active compounds in the Venn diagram are represented by roman numerals, and the matching area of the 3D correlation plot are indicated.

