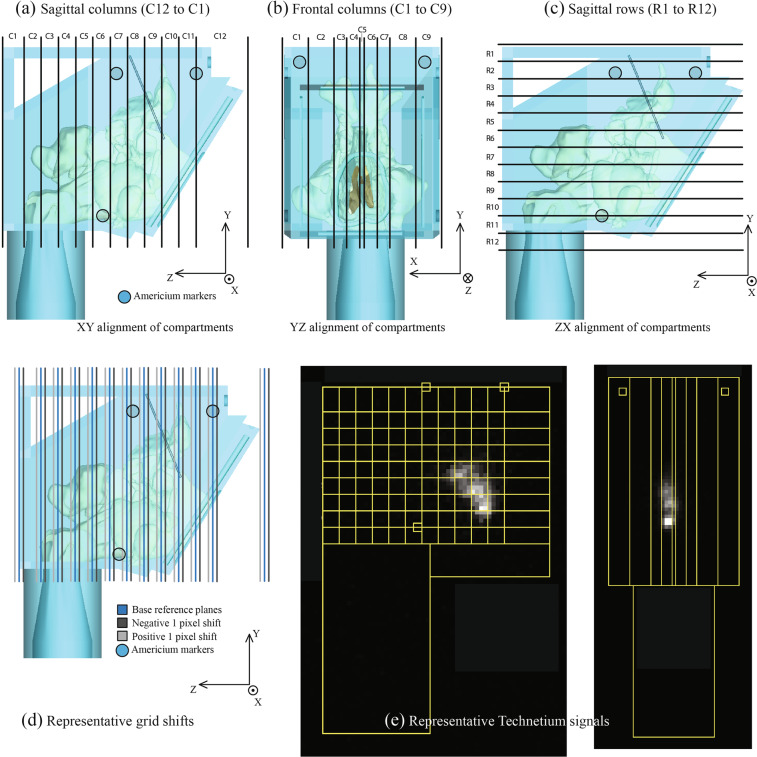
Figure 3.
Panels (a), (b), and (c) depict the gridline schematic on NPM1 and NPM2, that is used to extract the deposition fractions from the gamma scintigraphy-based quantification of the sprayed deposits in the solid replicas. The models are respectively segregated into 3 sets of compartments: sagittal columns, frontal columns, and sagittal rows. Panel (d) shows the perturbation of the base gridline by 1 pixel. Representative Technetium signals are in panel (e). Note: In regard to the axis system, the circle with solid dot implies out-of-plane direction from this page, the circle with cross signifies into-the-plane of this page.

